It was 7:30 a.m. on a Tuesday when Maya, a marketing director at a fast-growing B2B startup, opened her campaign dashboard. She had bet big on LinkedIn ads to target decision-makers across the tech sector. What she saw surprised her: click-through rates had doubled, lead quality was up, and the cost per acquisition was lower than any other platform she used.
Maya’s experience isn’t unique. In 2025, LinkedIn continues to lead as the most effective platform for B2B advertising, driven by its professional user base, improved targeting tools, and growing ad inventory. With businesses tightening budgets and demanding clearer ROI from digital marketing, LinkedIn’s ad ecosystem is proving its value more than ever.
This article takes a deep dive into the latest LinkedIn advertising statistics for 2025, giving marketers a clearer picture of where the platform stands and how to use it strategically.
Editor’s Choice
- LinkedIn’s total advertising reach now exceeds 1.1 billion users, marking a 10% increase year-over-year.
- The platform generated approximately $7.4 billion in ad revenue in 2024, and it’s projected to hit $8.2 billion in 2025.
- B2B brands account for nearly 85% of total ad spend on LinkedIn.
- LinkedIn ads boast an average conversion rate of 6.3%, significantly higher than most other social platforms.
- The average cost per click (CPC) has risen slightly to $6.20, reflecting growing demand.
- Sponsored content on LinkedIn sees a 45% higher engagement rate.
- 84% of marketers say LinkedIn is the most effective platform for lead generation.
- Mobile accounts for over 65% of ad impressions on the platform.
- LinkedIn’s ad tools now support AI-driven audience segmentation, improving targeting accuracy by 25%.
- The platform’s click-through rate (CTR) has improved by 12% year-over-year, with sponsored posts leading the way.
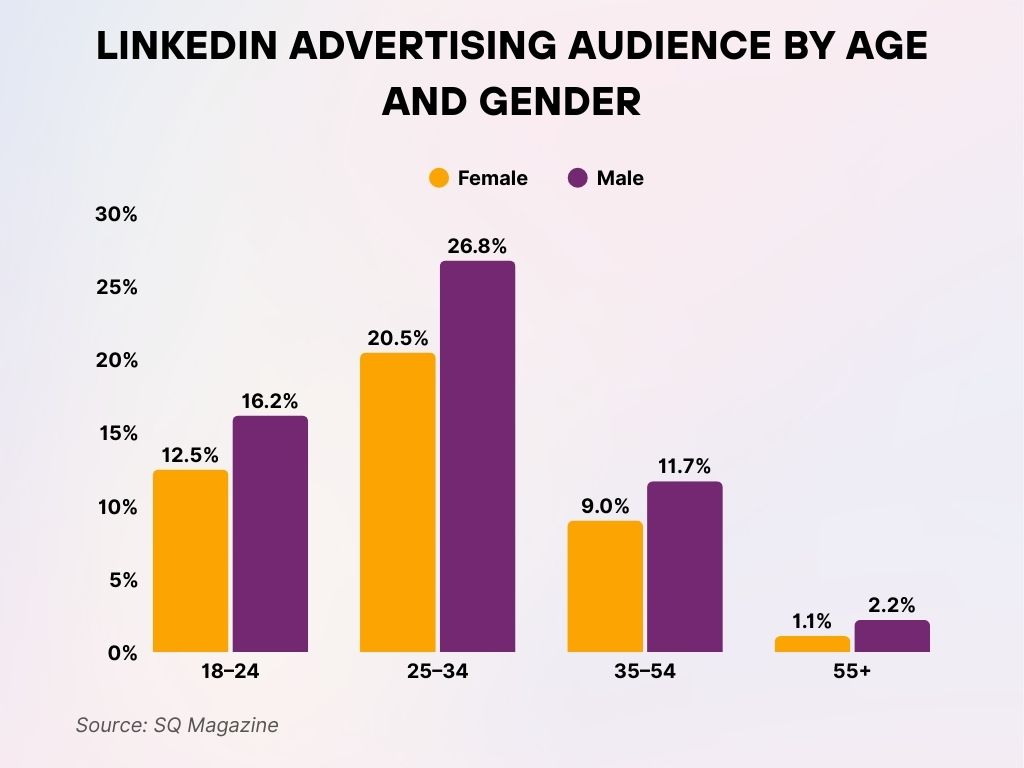
LinkedIn Advertising Audience by Age and Gender
- Ages 18–24 make up a notable portion of LinkedIn’s ad audience, with 16.2% male and 12.5% female users.
- Ages 25–34 represent the largest demographic, comprising 26.8% male and 20.5% female of the ad audience.
- Ages 35–54 account for a moderate share, with 11.7% male and 9.0% female representation.
- The 55+ age group has the smallest share, with 2.2% male and just 1.1% female users in the advertising audience.
Total Ad Reach on LinkedIn
- As of 2025, LinkedIn’s global ad reach stands at 1.1 billion users.
- North America makes up 24% of the total ad audience, followed by Europe at 21%.
- In the U.S. alone, LinkedIn reaches over 215 million users with advertising.
- Southeast Asia saw the highest year-over-year growth in ad reach, up by 18%.
- Latin America’s ad reach increased by 11%, driven by B2B startups and remote work trends.
- The average user on LinkedIn is exposed to 14 ads per session.
- Ad saturation is still lower than platforms like Facebook, allowing for more visibility per dollar spent.
- LinkedIn’s reach among senior-level decision-makers has grown to 71% in 2025.
- The platform now supports ad targeting in over 200 countries and territories.
- The number of advertisers using LinkedIn ads has crossed the 2.3 million mark, a 14% increase from last year.
LinkedIn Advertising Revenue Trends
- LinkedIn’s ad revenue is expected to hit $8.2 billion in 2025.
- The platform’s advertising business has seen consistent double-digit growth since 2021.
- Revenue from video ads alone grew by 22% in the last year.
- Sponsored InMail campaigns now contribute to 19% of total ad revenue.
- The U.S. accounts for 48% of total ad revenue on LinkedIn.
- Ad revenue from the technology sector alone exceeded $1.1 billion.
- Financial services and consulting sectors are the second and third biggest ad spenders, respectively.
- The average revenue per user (ARPU) globally now stands at $7.50.
- SMB advertisers have grown their spending by 18% year-over-year, signaling increased adoption.
- Revenue from AI-enhanced campaign tools now makes up 10% of LinkedIn’s ad earnings.
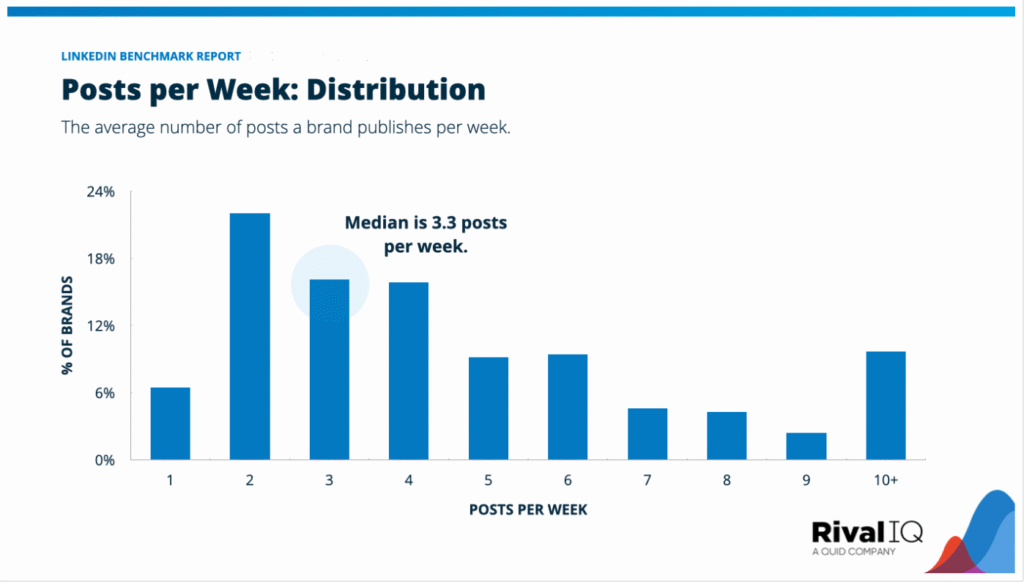
LinkedIn Brand Posting Frequency
- The median posting frequency on LinkedIn is 3.3 posts per week.
- The highest share of brands (~22%) publish 2 posts per week.
- Around 16% of brands post 3 times weekly, and a similar share post 4 times.
- About 9% of brands post 5 or 6 times per week, respectively.
- Only 6% of brands post once per week.
- Less than 5% post 7–9 times weekly, showing reduced frequency at higher ranges.
- Surprisingly, over 10% of brands post 10 or more times per week, showing high-content activity.
LinkedIn Ad Engagement Rates
- The average engagement rate for sponsored content is 0.58% in 2025.
- Video ads lead with a 1.1% engagement rate, outperforming static ads by 60%.
- Carousel ads have shown a 27% increase in engagement year-over-year.
- LinkedIn users are 2.3x more likely to engage with job-related ads than with brand awareness content.
- Engagement rates are highest in the tech, education, and consulting industries.
- Ads featuring real people (founders, employees) outperform branded graphics by 32%.
- Lead gen form ads have a 13% submission rate, the highest among all ad types.
- Engagement rates for sponsored InMail have held steady at around a 3.5% open rate, with a click-to-open ratio of 15%.
- Interactive ad formats are seeing early adoption with a 9% engagement bump.
- Posts with short, clear copy (under 150 characters) have 20% better engagement than longer ads.
LinkedIn CPC and CPM Benchmarks
- The average cost per click (CPC) on LinkedIn in 2025 is $6.20.
- Cost per thousand impressions (CPM) averages $37.90, with variances across industries and targeting parameters.
- Sponsored video ads command a higher CPM of $43.10, reflecting stronger engagement rates.
- Lead Gen Form ads maintain a CPC average of $5.70, delivering better ROI for conversion-focused campaigns.
- CPCs are lowest in the education and nonprofit sectors, averaging around $3.90.
- Campaigns targeting executive-level job titles have the highest average CPC at $8.40.
- Retargeting campaigns see CPCs decrease by 15%, making them more cost-efficient than cold outreach.
- Ads with custom audience lists experience up to 30% higher CPMs, due to niche targeting.
- LinkedIn’s AI-driven bid optimizer has helped reduce CPM waste by 12%.
- Mid-funnel campaigns have the best balance of CPC and engagement, averaging $5.80 CPC and $32 CPM.
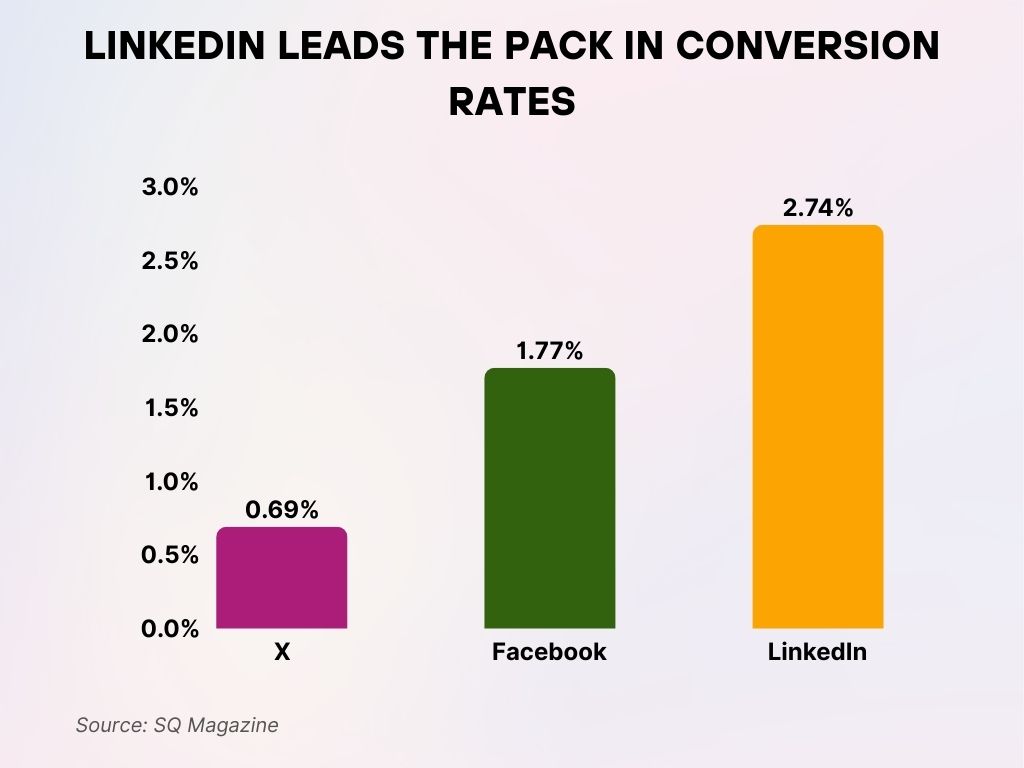
LinkedIn Leads the Pack in Conversion Rates
- LinkedIn delivers the highest visit-to-lead conversion rate at 2.74%, making it the top social network for lead generation.
- Facebook follows with a modest conversion rate of 0.77%, significantly lower than LinkedIn.
- X (formerly Twitter) ranks last, with a conversion rate of just 0.69%.
These figures highlight LinkedIn’s dominance in turning visitors into leads, outperforming other major social platforms by a wide margin.
Industry-Wise Performance of LinkedIn Ads
- Technology companies continue to dominate LinkedIn ad spending, contributing to over 29% of total ad impressions.
- The financial services sector boasts the highest average CTR at 0.74%, followed closely by consulting firms.
- Healthcare and pharmaceuticals saw the biggest jump in LinkedIn ad spending in 2025, up 21% year-over-year.
- The education industry benefits from lower CPCs, averaging $4.20, and solid engagement rates at 0.61%.
- Manufacturing companies have increased ad spend by 16%, targeting recruitment and supplier connections.
- Ads from legal and professional services see a strong lead conversion rate of 7.1%.
- The real estate industry continues to underperform on LinkedIn with an average CTR of just 0.34%.
- Retail brands are leveraging LinkedIn primarily for hiring and brand awareness, not direct sales.
- SaaS businesses show a healthy balance of CPC ($6.50) and conversion (6.5%) metrics.
- Startups and SMBs increased their presence on LinkedIn by 18% in 2025, with a noticeable focus on inbound recruiting.
B2B vs. B2C LinkedIn Ad Effectiveness
- B2B advertisers account for 85% of all ad spend on LinkedIn, reinforcing its position as the leading B2B platform.
- The average CTR for B2B campaigns is 0.65%, compared to just 0.39% for B2C.
- Conversion rates are higher in B2B (6.3%) than in B2C (3.2%) due to stronger lead qualification.
- B2C campaigns are generally more expensive, with an average CPC of $6.80 compared to $6.10 for B2B.
- B2B content types like whitepapers and webinars generate 2x more engagement than general product ads.
- B2C brands using employer branding and recruitment messaging see better results than sales-focused campaigns.
- B2B retargeting efforts deliver conversion rates up to 9.5%, outperforming B2C remarketing efforts by a wide margin.
- B2B leads from LinkedIn are considered 277% more effective than those from Facebook, according to recent internal benchmarks.
- Enterprise B2B campaigns using ABM (account-based marketing) strategies on LinkedIn report 14% higher ROI.
- B2C advertisers that personalize ad messaging by career level or industry see engagement improvements of up to 22%.
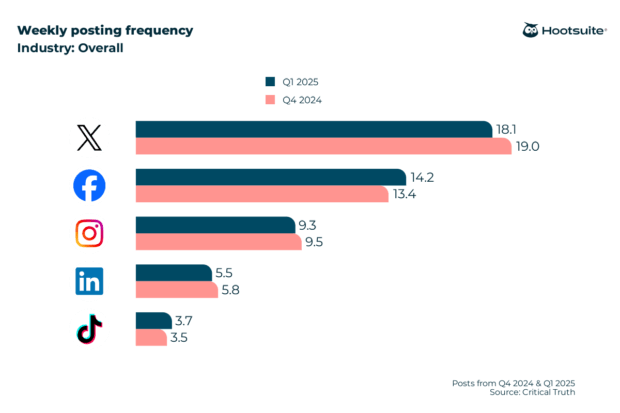
Weekly Posting Frequency by Platform
- X saw a slight drop, posting 18.1 times per week in Q1 2025, down from 19.0 in Q4 2024.
- Facebook increased activity, averaging 14.2 posts per week in Q1 2025, up from 13.4.
- Instagram decreased slightly, with 9.3 posts per week in Q1 2025, down from 9.5.
- LinkedIn posted 5.5 times per week in Q1 2025, slightly below the 5.8 in Q4 2024.
- TikTok saw a small increase, reaching 3.7 posts per week in Q1 2025, up from 3.5.
LinkedIn Video and Sponsored Content
- Video ads now account for 38% of all ad formats on LinkedIn in 2025.
- The average watch time for video ads is 7.4 seconds, with higher retention on short-form content under 15 seconds.
- Sponsored content remains the top-performing ad type, generating the highest CTR at 0.68%.
- Video ads with subtitles perform 23% better in engagement than those without.
- LinkedIn added autoplay with sound off, improving initial video engagement by 12%.
- Native video ads outperform YouTube links shared on the platform by 3x in CTR.
- Sponsored posts with real company case studies have shown 48% higher engagement rates.
- Carousel ads with video+text combos generate a 16% increase in dwell time over single-image formats.
- Event promotion ads using video see a 2.4x higher click-through rate than text-only formats.
- The top 10% of video content accounts for nearly 80% of video ad engagement, emphasizing the need for high-quality creative.
Conversion Rates from LinkedIn Ads
- The average conversion rate on LinkedIn in 2025 is 6.3%.
- Lead Gen Form ads lead the pack with a conversion rate of 13%, thanks to their seamless UX.
- Sponsored InMail campaigns convert at around 4.7%, with higher effectiveness in recruiting and event sign-ups.
- Retargeting ads enjoy conversion rates above 9%, proving the value of repeated exposure.
- LinkedIn ads for webinars and downloadable resources show the strongest mid-funnel performance.
- Landing page optimization impacts performance significantly; mobile-optimized pages convert 18% higher than desktop-only formats.
- Direct-response ads offering free trials or demos see conversion rates around 8.2%.
- Conversion rates are highest for campaigns targeting senior managers and above, at 7.4%.
- Ads with A/B tested creatives showed a 22% improvement in conversion rates compared to single-variant ads.
- Industries like SaaS, financial services, and consulting consistently see conversion rates above the platform average.
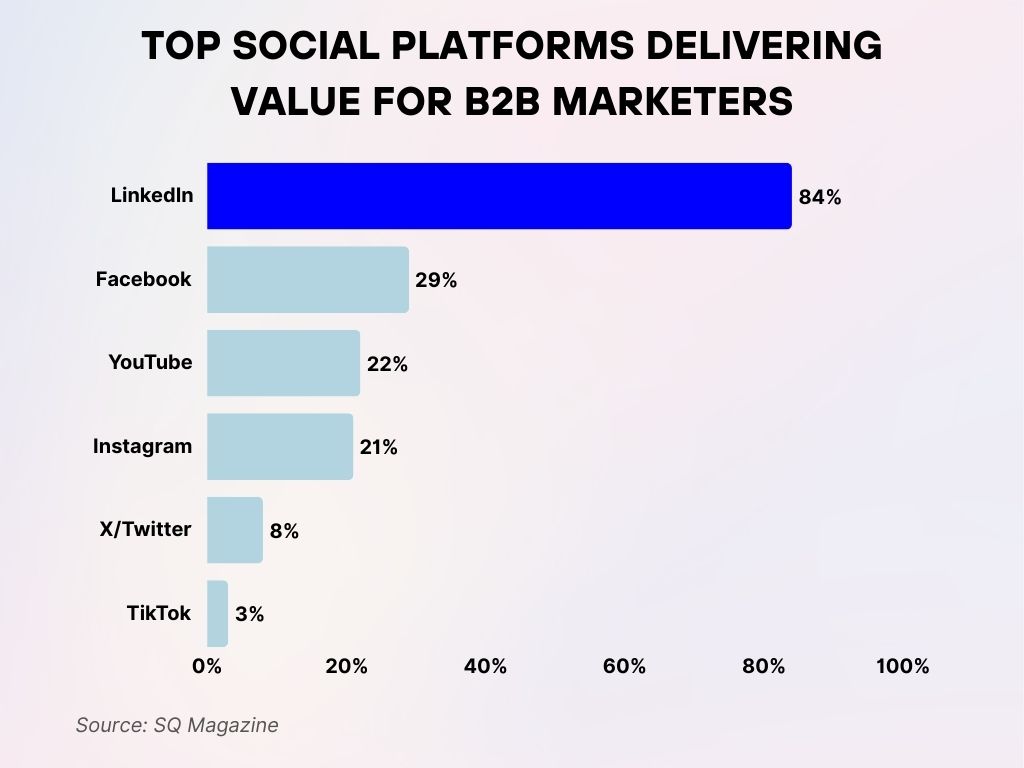
Top Social Platforms Delivering Value for B2B Marketers
- LinkedIn leads overwhelmingly, with 84% of B2B marketers saying it delivers the best value for their organization.
- Facebook comes in second but trails far behind, with only 29% of marketers citing it as valuable.
- YouTube is close behind at 22%, reflecting strong but niche relevance in B2B.
- Instagram is seen as valuable by 21% of B2B marketers, showing a moderate impact.
- X/Twitter holds just 8%, suggesting limited value in B2B contexts.
- TikTok ranks lowest, with only 3% of marketers finding it beneficial for B2B marketing.
Mobile vs. Desktop Ad Performance on LinkedIn
- In 2025, mobile devices account for 67% of all LinkedIn ad impressions.
- Despite higher mobile impressions, desktop still drives 58% of conversions, especially for B2B campaigns.
- The average CTR on mobile is 0.52%, slightly lower than 0.63% on desktop.
- CPC on desktop averages $6.50, compared to $5.90 on mobile, reflecting a cost-effective tradeoff for reach.
- Lead Gen Forms perform 22% better on desktop, due to easier input and higher-intent users.
- Mobile users spend more time browsing content, yet are less likely to take immediate conversion actions.
- Sponsored InMail open rates are higher on desktop (4.1%) versus 3.4% on mobile.
- Campaigns designed with mobile-first visuals and short copy outperform desktop-centric creatives by 17% in engagement.
- Interactive ad formats, like polls and carousel sliders, show 10% higher participation on mobile.
- For industries like tech and education, mobile conversions have increased by 19% year-over-year, reflecting growing mobile user intent.
LinkedIn Ads vs. Other Social Media Platforms
- LinkedIn’s average conversion rate (6.3%) outperforms Facebook (4.7%), Twitter (3.6%), and Instagram (3.2%) for B2B campaigns.
- CPCs are higher on LinkedIn, but the quality of leads is consistently rated superior by 82% of marketers.
- TikTok and Instagram offer broader reach, but LinkedIn delivers 2x more qualified B2B leads.
- Facebook’s CPM ($14.10) is significantly lower than LinkedIn’s CPM ($37.90), but with reduced targeting granularity for professional audiences.
- Twitter’s ad engagement dropped by 9% in the last year, while LinkedIn’s rose by 12%.
- Instagram Stories may win on visual creativity, but LinkedIn Sponsored Content wins on depth of engagement.
- For account-based marketing (ABM), LinkedIn remains the most preferred platform, used by 78% of B2B marketers.
- Lead Gen Forms on LinkedIn outperform Facebook’s native forms by 1.8x in submission rate.
- Snapchat and TikTok show higher engagement with Gen Z but lack the job and industry targeting depth that LinkedIn offers.
- LinkedIn is the only platform where job title and company targeting can be executed at scale without third-party cookies.
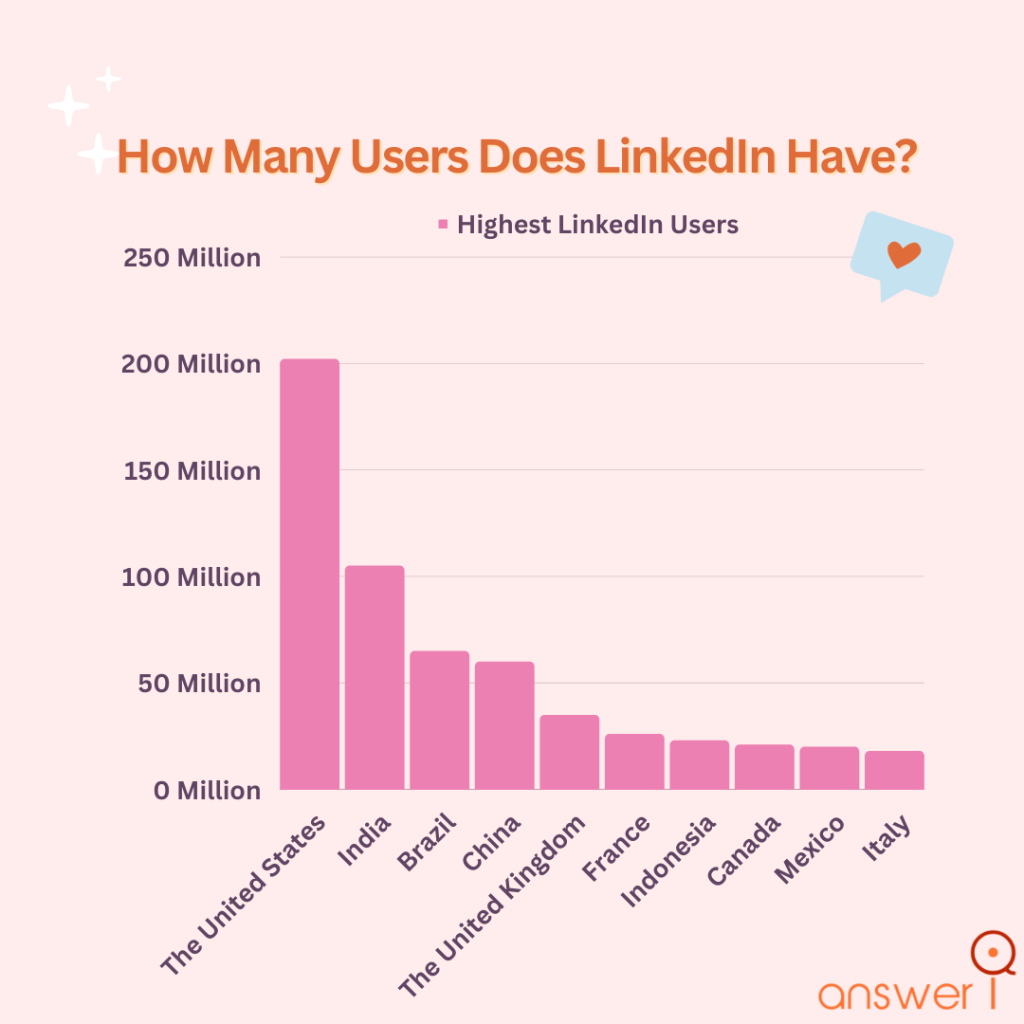
Top Countries by LinkedIn Users
- The United States leads with over 200 million LinkedIn users, making up the platform’s largest user base.
- India ranks second with approximately 100 million users, reflecting rapid professional networking growth.
- Brazil and China follow, each with over 50 million users, showing strong adoption in major global markets.
- The United Kingdom has a notable user count of around 55 million.
- Countries like France, Indonesia, Canada, Mexico, and Italy each contribute between 20 to 35 million users.
Budget Allocation Trends for LinkedIn Marketing
- In 2025, B2B marketers allocate an average of 28% of their digital ad budget to LinkedIn.
- Enterprise businesses increased their LinkedIn spend by 17%, especially for lead generation and talent acquisition.
- SMBs now represent 32% of LinkedIn’s advertiser base.
- The average monthly spend per advertiser on LinkedIn is approximately $1,380, with large accounts spending significantly more.
- Retargeting and lead-gen campaigns make up more than 55% of total ad spend on the platform.
- Companies targeting C-suite and VPs spend 25% more per campaign than those targeting mid-level roles.
- Industry-specific content campaigns are seeing growing investment, especially in tech, SaaS, and healthcare sectors.
- Advertisers are allocating more toward AI-optimized placements, which saw a spend increase of 19% year-over-year.
- Brand awareness campaigns account for only 18% of spend, while conversion-focused ads lead with 62%.
- A growing trend in monthly A/B testing budgets has emerged, with over 60% of advertisers dedicating funds specifically for experimentation.
Recent Developments in LinkedIn Advertising
- In early 2025, LinkedIn introduced predictive lead scoring, helping advertisers prioritize higher-conversion prospects.
- The platform rolled out auto-generated ad creatives using generative AI, reducing setup time by over 30%.
- A new audience sentiment analysis tool helps marketers adjust messaging based on real-time engagement feedback.
- LinkedIn’s AI-powered campaign manager now recommends bidding strategies that improve ROI by up to 15%.
- Interactive ad formats, such as polls and quizzes, gained traction with 14% higher engagement than standard formats.
- LinkedIn expanded its native event promotion tools, integrating calendar sync and follow-up reminders.
- Integration with Salesforce and HubSpot improved, allowing for real-time lead syncing and segmentation.
- The platform enhanced multi-language support for global campaigns, now available in over 25 languages.
- LinkedIn Ads now support video retargeting, enabling brands to re-engage users who watched specific content segments.
- The company has committed to greater transparency in ad metrics, including estimated audience quality and ad fatigue indicators.
Conclusion
As we move through 2025, one thing is clear: LinkedIn has carved out a distinct and indispensable role in the digital advertising landscape, especially for B2B marketers. While platforms like Facebook and TikTok may dominate conversations around reach and virality, LinkedIn quietly delivers high-intent, professional traffic that converts.
From rising ad engagement and expanding international reach to smarter tools and AI-driven optimizations, LinkedIn continues to evolve as a premium advertising channel. Marketers who invest time in understanding its nuances, balancing CPCs with quality, segmenting audiences with precision, and leveraging content formats effectively will reap the rewards of one of the most conversion-rich ecosystems in digital media.
If you’re planning your next marketing move, don’t underestimate what LinkedIn Ads can deliver in 2025. Your future leads, and your ROI might already be scrolling.

