Conversion Rate Optimization (CRO) has become a core focus in digital marketing and UX strategy. Businesses are increasingly judged not just by traffic, but by how efficiently they turn visitors into customers or leads. In industries from e-commerce to SaaS, even a 0.5% lift in conversion can represent tens or hundreds of thousands of dollars in added revenue.
For example, a mid-sized online retailer that increases its conversion from 2.5% to 3.0% gains 20% more sales without needing extra traffic. In B2B SaaS, refining the free trial signup flow by a few tenths of a percent can multiply pipeline value. Let’s dig into the latest CRO statistics and benchmarks so you can see how your performance stacks up and where to improve.
Editor’s Choice
- Across industries, the average web conversion rate is about 2.9%.
- In B2B SaaS, average conversion rates decline to around 1.1%.
- E-commerce conversion rates trend between 2 % and 5% globally.
- Desktop shoppers convert at ~3.2%, while mobile users convert closer to 2.8% in retail contexts.
- The CRO tools market is projected to reach $5 billion by 2025.
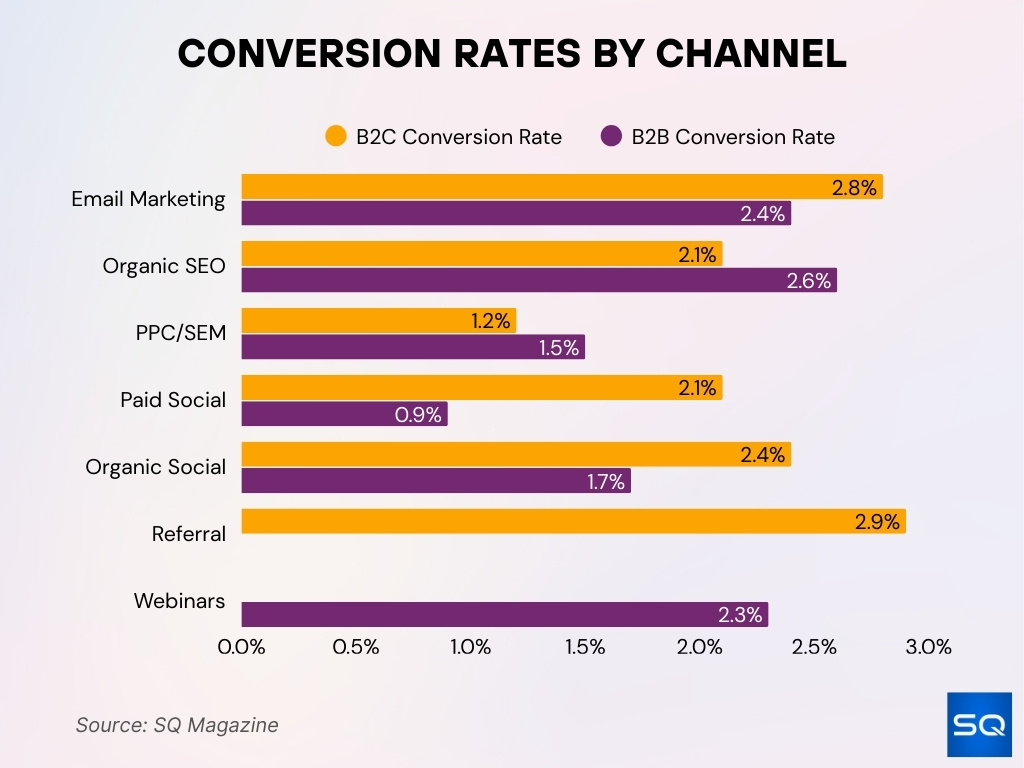
- In channel-level performance, email marketing leads B2C conversions (~2.8%), with PPC/SEM lagging (~1.2%).
- The median conversion rate across many industries reaches 6.6% in benchmark reports.
Recent Developments
- Multi-touch attribution frameworks, versus last-click only, are gaining adoption for more accurate conversion credit modeling.
- Use of multi-task learning models to better predict rare and small-scale conversions is rising in the ad tech space.
- Research shows UX improvements in mobile apps can materially improve retention and conversions, especially for first-time users.
- E-commerce platforms report increasing mobile traffic share (≥70%) while seeing conversion gaps widen between mobile and desktop.
- Benchmarks sharpen, more firms publish conversion stats by micro-segment, making comparisons more meaningful.
- The CRO tool market has seen accelerated consolidation and innovation, driven by AI and automation features.
- Privacy and cookies changes, in a post-third-party cookie world, are pushing reliance on first-party data and trust signals in optimization.
General Conversion Rate Statistics
- The average conversion rate across all industries is ~2.9%.
- The median conversion rate across many industry benchmarks is 6.6%, illustrating how high performers uplift the middle.
- Professional services tops industries with ~4.6% conversion, followed by industrial (4.0%) and auto (3.7%).
- B2C average conversion hovers at ~2.1%, while B2B sites often see lower (~1.8%).
- Ranges differ; some sectors, like financial, legal, or health, may see 3%+ in favorable conditions.
- In e-commerce, conversion is often under 2% in many reports.
- The global e-commerce conversion rate band is ~2% to 5% depending on device mix and category.
- In high-intent channels, some campaigns, like landing page click-throughs, report median conversion rates over 10%.
Conversion Rates by Device
In retail/commerce benchmarks, desktop conversion is ~3.2%, mobile is ~2.8%, and overall ~2.9%.
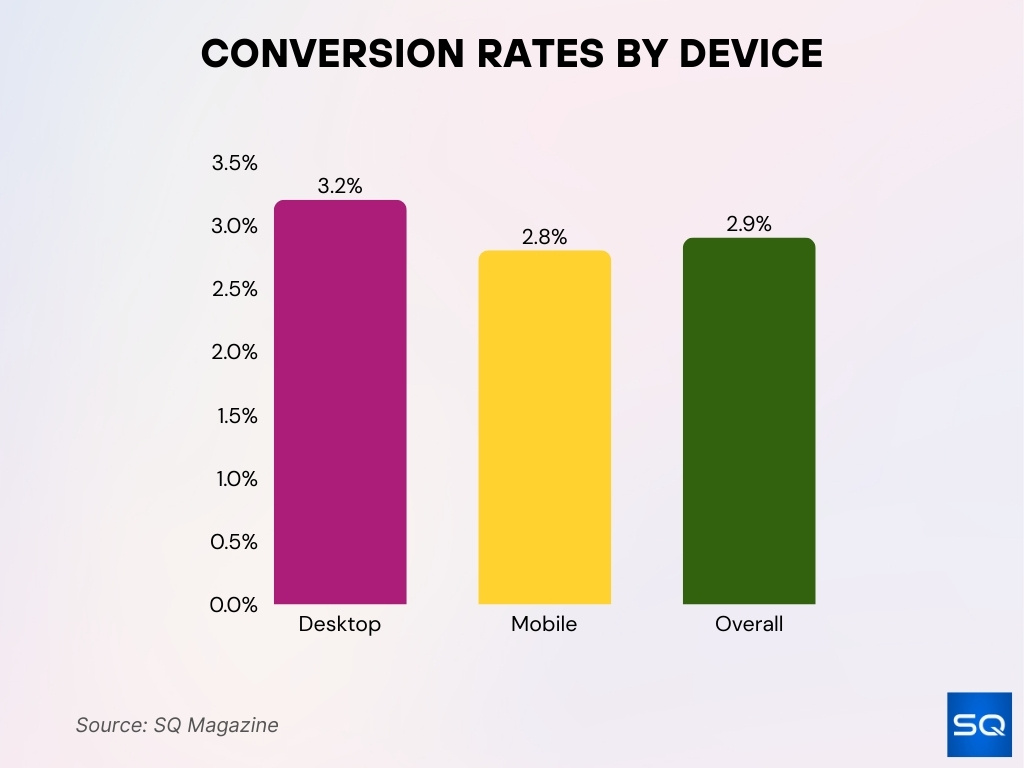
- Mobile traffic often forms 70%+ of visits, yet it underperforms in conversion, placing pressure on mobile UX.
- Tablet performance often sits between mobile and desktop or is rolled into desktop stats.
- In e-commerce, the conversion rate disparity can be 1.7x or more between desktop and mobile.
- Smaller, performance-tuned mobile sites see narrower gaps, but average sites still lag significantly.
- Device-based optimizations, responsive design, and reduced friction are now baseline expectations.
Landing Page Conversion Rate Statistics
- The median landing page conversion rate across industries is ~6.6%.
- For e-commerce landing pages, the median conversion sits around 4.2%.
- In the SaaS space, median landing page conversions are closer to 3.8%.
- Lead generation landing pages average ~11.9% conversion.
- Some landing pages with optimized design and targeting see conversion rates over 20%, especially in niche verticals.
- A/B testing on landing pages can boost conversion by up to 30% over baseline versions.
- Pages that load faster or reduce distractions tend to see higher conversion lift.
- Many marketers (≈ 48%) build a new landing page per campaign to test messaging and design variations.
- Over 50% of landing pages are not fully optimized for mobile viewing or conversion performance.
Page Load Speed and Conversion Rates
- Pages that load in 2.4 seconds convert at ~1.9%, but at 3.3 seconds, this drops to ~1.5%.
- At 4.2 seconds, conversion rates often fall below 1%.
- If load time reaches 5.7+ seconds, conversion may drop as low as 0.6%.
- The average site conversion declines by ~4.42% per second of additional load time (for the first 0–5 seconds).
- A 1-second delay in load time can lead to up to 7% decline in conversions.
- Walmart found that speeding pages by 1 second yielded a 2% boost in conversions.
- B2B sites that load in 1 second convert at ~3× higher rates than those loading in 5 seconds.
- On mobile, each additional second may reduce conversions by as much as 20%.
Conversion Rates by Channel
- In B2C, email marketing ~2.8%, organic SEO ~2.1%, PPC/SEM ~1.2%.
- In B2B, SEO ~2.6%, email ~2.4%, webinars ~2.3%, PPC ~1.5%.
- Paid social in B2C converges around 2.1%, vs B2B ~0.9% in many reports.
- Organic social sees ~2.4% in B2C, ~1.7% in B2B.
- Referral traffic averages ~2.9% conversion across industries.
- Webinars show a B2B conversion of ~2.3% in many analyses.
- In paid channels, SEM/PPC ~1.5% in B2B, ~1.2 in % B2C context.
Impact of User Experience on Conversion Rates
- A well-designed UX can increase conversion rates by up to 200%; top-tier UX improvements may push that to 400%.
- Increasing UX budget by 10% is correlated with an 83% uplift in conversion metrics in some studies.
- 88% of users won’t return to a site after a poor user experience.
- Mobile users are ~5× more likely to abandon a site that’s not mobile-friendly.
- UX-centric companies tend to grow twice as fast as industry averages.
- Friction in navigation or confusing menus dramatically increases drop-off rates.
- Smooth, consistent flows, especially for mobile and responsive design, show better retention and conversion outcomes.
- Poor experience in checkout, form submission, or page transitions often accounts for the biggest losses in conversion funnels.
Effect of A/B Testing on Conversion Rates
- A/B testing is among the top methods marketers use to improve conversions, second only to analytics.
- Simple A/B changes, headlines, buttons, and form design can yield gains in the 10–30% range.
- In some enterprise settings, iterative experimentation added ~20% extra lift beyond single-round tests.
- The adoption of automated or agent-based A/B systems is rising (e.g., LLM-driven test agents).
- Multivariate testing, testing combinations of elements, complements simple A/B for granular tuning.
- A/B tests require a sufficient sample size; underpowered tests can produce misleading results.
- Teams that test more variations within a campaign often learn faster and compound gains.
- Even micro-changes, button color, and positioning across many tests accumulate to meaningful uplifts.
Conversion Rate by Traffic Source
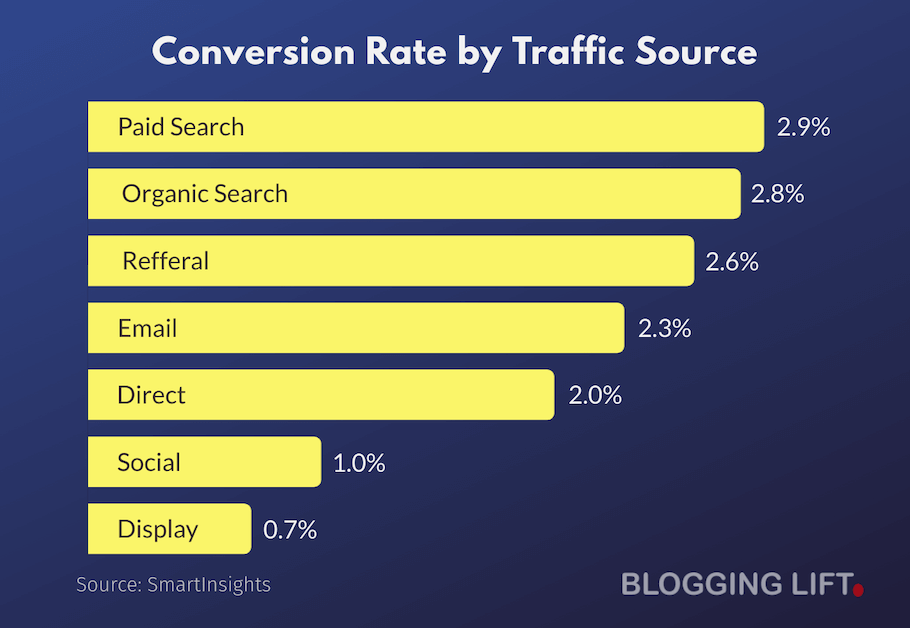
- Paid Search delivers the highest conversions at 2.9%.
- Organic Search follows closely with a 2.8% conversion rate.
- Referral traffic achieves a solid 2.6% conversion rate.
- Email campaigns convert at around 2.3%.
- Direct traffic records a 2.0% conversion rate.
- Social media has a lower impact, converting at just 1.0%.
- Display ads show the weakest performance with 0.7% conversions.
Lead Generation and Form Optimization Statistics
- In many industries, the average form rate is ~1.7% (fraction of site visitors that fill a form).
- Many B2C firms report landing page view-to-submission rates up to ~10% for high-performing campaigns.
- Forms with 5 or fewer fields often outperform longer forms in completion rate.
- Multi-step or progressive forms reduce user overwhelm and increase completion rate (often ~10% improvement).
- Removing “phone number” as a required field can improve form conversions significantly.
- Replacing dropdowns with radio buttons and simpler input types yields better conversion in many tests.
- Nearly half of marketers (≈ 46%) say form layout significantly impacts performance.
- Transparency about cost or fees in the form flow improves trust and submission rates.
Call-to-Action (CTA) Performance Statistics
- In a meta-analysis from 2025, lightbox popup CTAs for email sign-ups averaged ~9.8% conversion.
- For “offer/deal” CTAs in the same lightbox style, conversion averaged ~6.3%.
- Full-page popups for content download CTAs reached ~13.6% conversion in some datasets.
- Mid-page banners for contact us CTAs come in low, around ~0.9%.
- Personalized CTAs, versus generic, yield ~42% higher conversion.
- CTAs placed above the fold or near key scroll thresholds see better click and conversion rates.
- CTA text using action verbs (“Get”, “Try”, “Download”) outperforms bland labels like “Submit” or “Continue”.
- Testing CTA color, size, and context can move performance by 10–20% in many AB test cases.
Most Used CRO Techniques
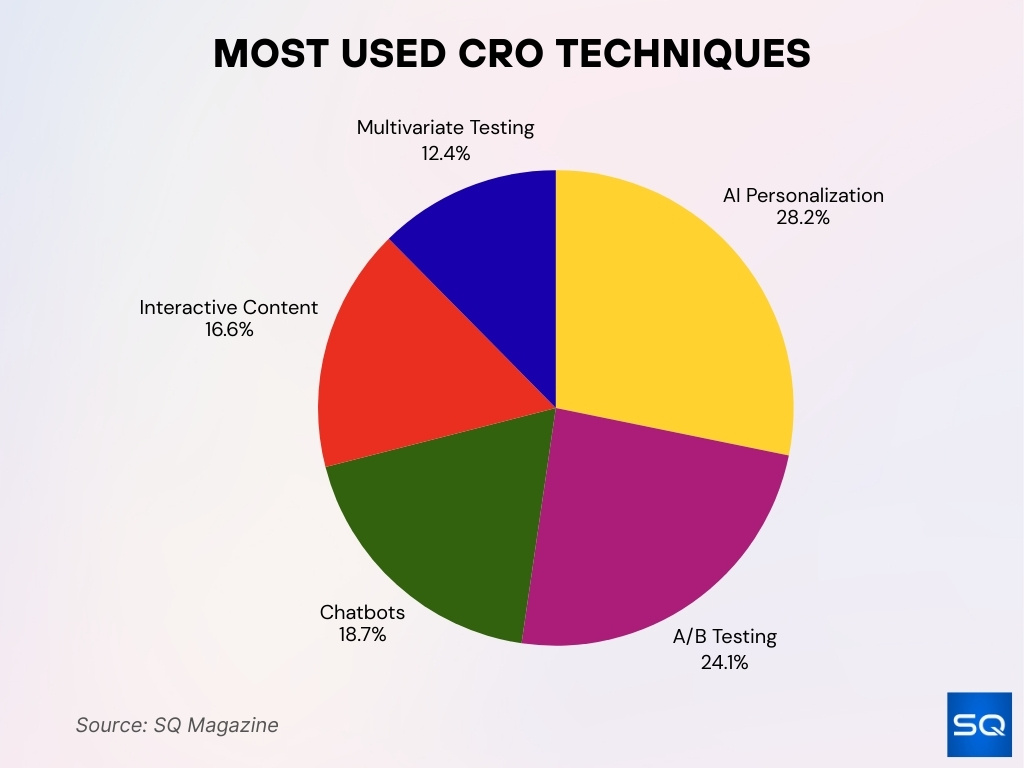
- AI Personalization is the leading technique, used by 28.2% of marketers.
- A/B Testing follows closely, adopted by 24.1% of professionals.
- Chatbots play a growing role, applied by 18.7% of businesses.
- Interactive Content is utilized by 16.6% of companies.
- Multivariate Testing is used by 12.4%, making it the least common among the top methods.
Testing and Optimization Tools Adoption
- 69% of marketers report using web analytics tools in their CRO stack, the most widely adopted category in 2025.
- 64% employ user experience testing among their conversion-enhancement methods.
- 61% of organizations use personalization tools as part of their CRO efforts.
- 57% integrate content testing, e.g., headlines, copy, into their optimization workflows.
- The global CRO tools market is projected to hit $5.07 billion in 2025.
- Firms using CRO tools report an average ROI of 223%.
- Only 39.6% of companies have a fully documented CRO strategy.
- Small slices of firms (≈ 5%) report no ROI from their CRO efforts.
- Cutting-edge adoption, AI-powered CRO platforms now claim average conversion lifts of ~25% for adopters.
Cart Abandonment and Recovery Statistics
- The average cart abandonment rate across industries is ~ 69.99%.
- On mobile, abandonment spikes, ~ 85.65% of carts are left incomplete.
- 48% of shoppers abandon their carts due to unexpected costs like shipping, tax, or handling fees.
- Abandoned cart emails see open rates of ~ 41.8%.
- These emails convert at around 10.7% on average.
- Some datasets show CTR ~ 21%, and conversion rates for recovered carts as high as 50% in specific contexts.
- Retailers lose an estimated $18 billion annually due to cart abandonment.
- Multi-channel recovery, email + retargeting ads, can reclaim ~ 27.62% of abandoned carts.
- 26% of users abandon carts because the site forces them to create an account.
Influence of Reviews and Social Proof
- Displaying reviews or user ratings can increase conversion rates by up to 270% in controlled settings.
- Products with existing reviews convert 12.5% higher than those without reviews.
- 93% of consumers say online reviews influence their purchase decisions.
- 94% of people say negative reviews have caused them to reject a brand.
- 86% of consumers say homepage reviews influence their trust and purchase decisions.
- Testimonials or social proof elements can boost conversions by ~ 34%.
- 72% of consumers trust customer images, user-generated, more than stock photography.
- 75% of shoppers check reviews before making a purchase.
- The “bandwagon effect”, when many people have purchased or rated a product, strongly correlates with higher purchase intent in experiments.
Impact of Video Content on Conversion Rates
- Adding video to product pages can increase conversions by up to 86% in certain controlled experiments, though the typical lift is more modest and context-dependent.
- Pages with video content often keep visitors on site longer, reducing bounce rate and increasing the chance of conversion.
- Video in email or landing pages drives higher engagement, click rates compared to static content.
- Explainer videos, in SaaS or B2B, further reduce friction and objection handling, especially early in the funnel.
- Video testimonials serve as social proof, magnifying trust signals already in place.
- Embedded product demos help users visualize value, especially in complex or technical offerings.
- Mobile video formats, short form, and autoplay are increasingly optimized, aligning with mobile-first traffic strategies.
- A/B test variants with video vs no video often show modest but consistent lift (+5–15%) depending on context.
Trends in CRO
- AI and automation are now core to modern CRO platforms, enabling predictive testing and real-time personalization.
- CRO is becoming more integrated across full user journeys, not just landing pages, from onboarding to retention.
- The shift away from third-party cookies is pushing more dependency on first-party data and consented tracking in optimization strategies.
- Voice search, chatbots, and conversational UI elements are being optimized for conversion context.
- Reactive personalization, based on real-time behavior, is complementing pre-segmented personalization.
- More marketers apply micro-experiments, small tweaks, on many pages, instead of monolithic redesigns.
- Full-funnel experimentation, cross-channel, is rising in importance.
- Adoption of privacy-first CRO methods, differential privacy, and clean rooms is growing to maintain optimization under stricter regulations.
CRO Budget and Investment Statistics
- Some companies dedicate up to 30% of their marketing budget to CRO.
- Average ROI for CRO investments is ~ 223%.
- Many SMEs spend ~$2,000/month on CRO tools and experimentation.
- Only ~39.6% of companies report having a fully documented and structured CRO plan.
- 5% of firms say they see no return from CRO initiatives.
- In project budgeting, a major share goes into human resources, A/B test setup, and implementation costs.
- Longer-term CRO programs, 6+ months, tend to outperform short bursts due to learning and compounding effects.
- Organizations with structured CRO teams perform more reliably compared to reactive or ad-hoc efforts.
- The cost to implement winning variations, hardcoding, design, dev, is often overlooked but significant in budgets.
Frequently Asked Questions (FAQs)
The average conversion rate across all industries is ~ 2.9%
The top 25% of landing pages convert at 5.31% or higher.
Companies using CRO tools report an average ROI of 223%.
The average cart abandonment rate across industries is ~ 69.99%
Only 39.6% of companies have a formally documented CRO strategy
Conclusion
Conversion Rate Optimization is no longer optional; it’s central to maximizing digital ROI. Across devices, channels, and funnel stages, we see consistent themes: speed, trust, data-driven testing, and intelligent tools are key levers. Companies that pair disciplined experimentation with smart investment in tools and process often reap outsized returns. As you compare your own metrics with benchmarks here, remember, the journey to higher conversion is iterative. Use the insights and forecasts above as a guide, and build your CRO roadmap one hypothesis at a time.


