In the spring of 1976, two college dropouts assembled a computer in a garage. Nearly five decades later, their company, Apple Inc., is now among the world’s most influential tech giants. From reshaping communication with the iPhone to pioneering digital ecosystems, Apple’s impact is etched across industries.
In 2025, Apple continues to push boundaries in innovation, sustainability, and user experience. This article dives deep into the latest Apple statistics, a data-backed narrative of where the brand stands today, and what the numbers reveal about its trajectory.
Editor’s Choice
- Apple’s global revenue reached $431 billion, marking a 4.3% increase YoY.
- The iPhone 15 series accounted for nearly 52% of total revenue in Q1 2025.
- Apple Services revenue hit $107 billion, becoming the second-largest business segment.
- As of March 2025, there are 2.08 billion active Apple devices in use worldwide.
- Mac and iPad sales saw a combined rise of 6.1%, bolstered by the M3 chip rollout.
- Apple’s market cap in Q1 2025 stands at $2.86 trillion, retaining its position as the most valuable publicly traded company.
- The App Store ecosystem generated over $138 billion in developer earnings in the past 12 months.
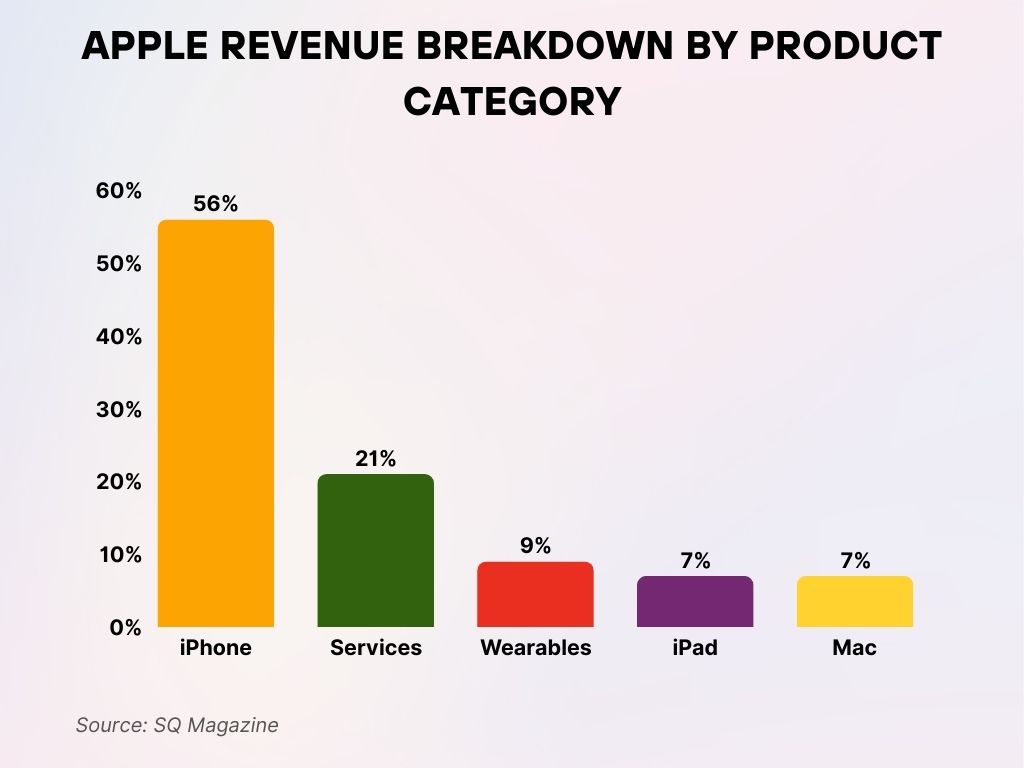
Apple Revenue Breakdown by Product Category
- The iPhone remains Apple’s biggest revenue driver, contributing 56% of the company’s total revenue.
- Services account for 21%, showcasing the growing importance of Apple’s digital ecosystem.
- Wearables, including the Apple Watch and AirPods, make up 9% of the revenue share.
- The iPad contributes 7%, maintaining a steady role in Apple’s product lineup.
- Mac computers also hold a 7% share, reflecting consistent demand for Apple’s computing devices.
Global Revenue and Profit Trends
- Apple’s total revenue in Q1 2025 stood at $117.3 billion.
- Gross profit margins have expanded to 45.9%, aided by higher-margin service offerings.
- Net income for the first half of 2025 has reached $57.4 billion, a 5.6% YoY increase.
- The Americas continue to lead in revenue share with $50.9 billion in Q1 2025, followed by Europe at $28.2 billion.
- Greater China accounted for $22.1 billion in revenue in Q1 2025, recovering from prior year contractions.
- Annual R&D spending now consumes 7.2% of Apple’s total revenue, reflecting intensified investment in AI and custom silicon.
- Apple’s effective tax rate is reported at 15.8%, consistent with global minimum tax discussions.
- Cash reserves as of March 2025 stand at $158 billion, maintaining Apple’s position as one of the most cash-rich companies globally.
- Foreign exchange headwinds reduced overall revenue growth by approximately $3.2 billion.
- Operating income in Q1 2025 rose to $37.6 billion.
- Subscription services like Apple One and iCloud+ contribute nearly 26% of total services revenue.
iPhone Sales Performance
- iPhone 15 series shipments have surpassed 94 million units globally in the first two quarters of fiscal 2025.
- The iPhone 15 Pro Max is the best-selling model in the U.S. and Japan, with 36% of premium market share in Q1.
- India has emerged as Apple’s fastest-growing iPhone market, with a 34% YoY growth rate.
- iPhone ASP (Average Selling Price) increased to $987 in 2025.
- The 5G-enabled iPhone models now constitute nearly 92% of all new unit sales.
- iPhone resale values continue to lead the industry, retaining up to 68% of their original value after one year.
- In the EU, iPhone market share rose to 27.1%, driven by carrier trade-in programs.
- Apple’s buyback and upgrade program facilitated 8 million iPhone trade-ins in the past 6 months.
- iPhone production is diversifying, with 28% of units now assembled outside of China, notably in India and Vietnam.
- iOS 18 adoption hit 81% within two months of release, a record for Apple’s mobile OS.
- iPhone users now engage in over 2 billion FaceTime calls daily.
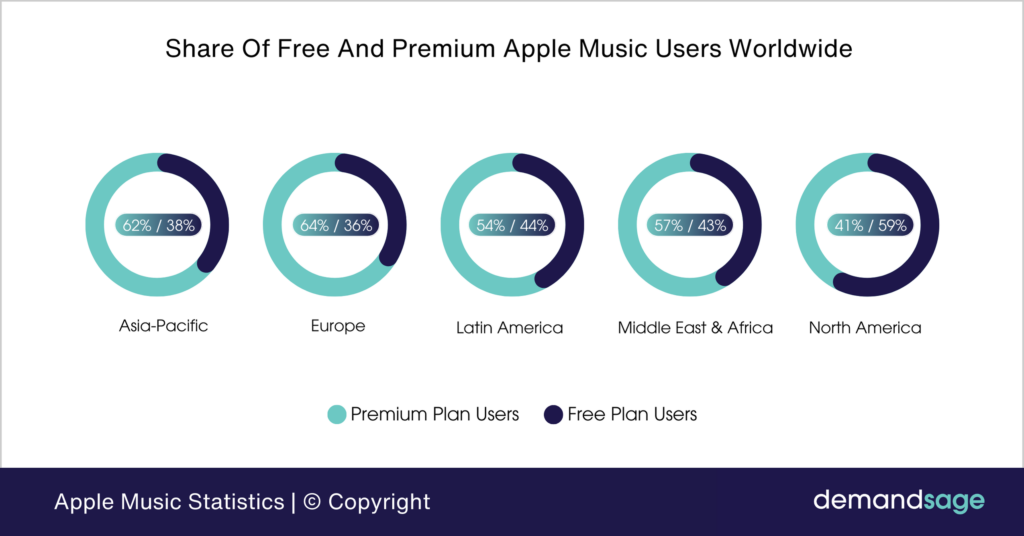
Share of Free vs. Premium Apple Music Users by Region
- In Asia-Pacific, 62% of users are on the Premium Plan, while 38% use the Free Plan.
- Europe shows a strong preference for premium, with 64% on Premium and 36% on Free.
- Latin America has a more balanced split: 54% Premium vs. 44% Free users.
- In the Middle East & Africa, 57% are Premium users, while 43% stick to the Free Plan.
- North America is the only region where Free Plan usage (59%) surpasses Premium (41%), showing unique user behavior.
Mac and iPad Market Statistics
- Mac revenue reached $10.6 billion in Q1 2025, driven by demand for M3-based MacBook Pros.
- iPad revenue was $8.2 billion, showing resilience amid a declining tablet market.
- Apple holds 23% of the U.S. laptop market, up 2% YoY due to strong education sector sales.
- The M3 chip delivers a 22% performance gain over the M2, contributing to improved Mac retention rates.
- iPad Air (2024) with the M2 chip has seen 42% sales growth year-over-year.
- Mac user satisfaction rates hit 95%, according to internal surveys conducted in early 2025.
- Apple’s education hardware shipments (Mac and iPad combined) grew 13% globally.
- The macOS 14 Sonoma rollout boasts a 78% install base adoption rate within 5 months.
- Enterprise Mac deployment increased by 18%, with notable growth in healthcare and creative industries.
- Apple Pencil (3rd Gen) sales are up 31%, signaling demand for productivity-focused iPads.
- iPadOS 18 introduces enhanced AI multitasking, boosting session length by 18 minutes per user daily.
Apple Services Growth Metrics
- Apple Services revenue reached a record $107 billion, accounting for nearly 25% of total revenue.
- As of Q1 2025, there are over 1.1 billion paid subscriptions across Apple’s service ecosystem.
- Apple Music now has 108 million subscribers.
- iCloud+ subscriptions have grown 15% year-over-year, with over 900 million active accounts.
- Apple TV+ saw a subscriber increase to 58 million, buoyed by exclusive series and bundled offers.
- Apple Pay usage rose by 18% globally, with nearly 60% of iPhone users in the U.S. using it weekly.
- Revenue from AppleCare and extended warranties increased to $8.4 billion in 2025.
- The Apple Arcade platform reported 12.6 million paid users, maintaining its foothold in casual gaming.
- Apple Books recorded a 23% increase in downloads year-over-year, with notable demand for audiobooks.
- The Fitness+ platform now logs 4.1 million active users monthly, with increased traction among Gen Z.
- Revenue per services user (RPU) now stands at $14.70, up from $13.20 last year.
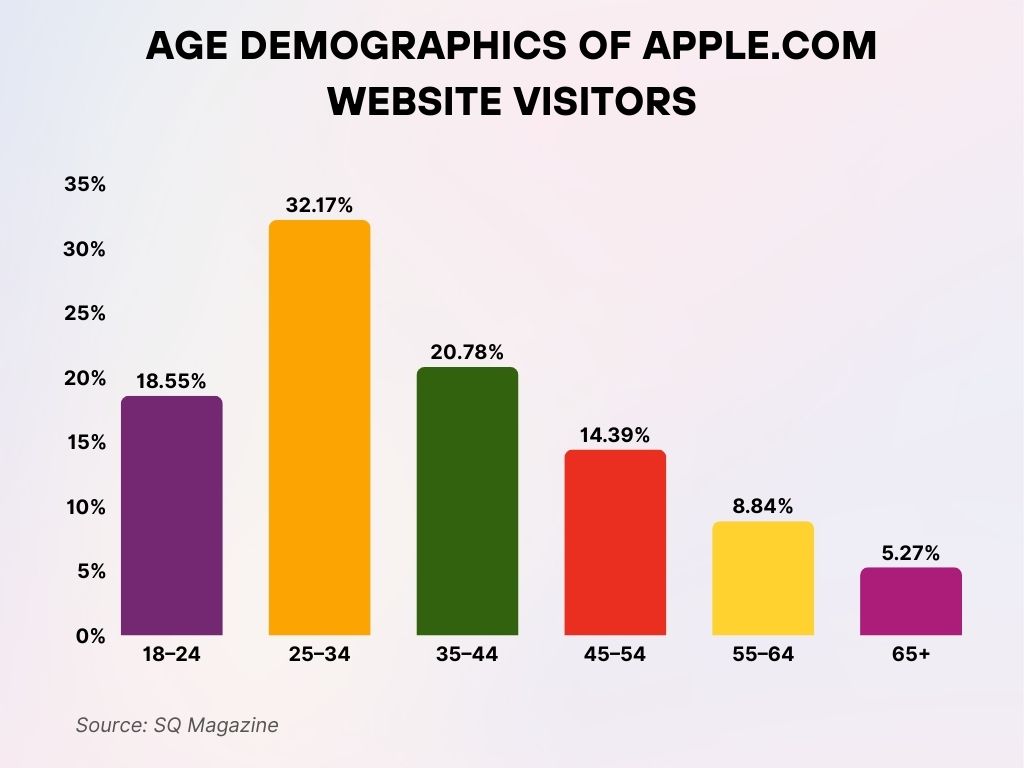
Age Demographics of Apple.com Website Visitors
- The largest age group visiting apple.com is 25–34, making up 32.17% of total traffic.
- Users aged 35–44 contribute 20.78%, showing strong engagement from mid-career professionals.
- The 18–24 age group accounts for 18.55%, highlighting Apple’s appeal among younger adults.
- Visitors aged 45–54 represent 14.39% of traffic to the site.
- The 55–64 demographic makes up 8.84%, indicating moderate usage among older adults.
- The 65+ age group forms the smallest segment, with 5.27% of traffic share.
Wearables and Home Devices Statistics
- Apple Watch shipments crossed 43 million units, making it the top-selling smartwatch worldwide.
- The new Apple Watch Ultra 2 contributed to 27% of total watch sales in Q1 2025.
- Apple Watch user base has exceeded 142 million, with a retention rate of over 89%.
- AirPods revenue was $19.6 billion, with a 6% YoY growth led by AirPods Pro 2 sales.
- AirPods now hold 35% of the global wireless earbuds market in Q1 2025.
- HomePod mini sales grew by 11%, contributing to Apple’s smart home ecosystem growth.
- Apple’s HomeKit integrations rose to over 125 million connected devices globally.
- The Find My network is now leveraged by more than 500 million devices, enhancing privacy-oriented tracking.
- Apple Vision Pro, the company’s AR/VR headset, sold 820,000 units in its first two months post-launch.
- Apple Watch’s health features helped trigger 31,000+ emergency service calls, highlighting real-world impact.
- The majority of new wearable users come from outside North America, with Asia-Pacific contributing 38% of global Apple Watch growth.
Apple Store and E-commerce Insights
- Apple operates 530+ retail stores across 26 countries, with Apple Singapore Orchard Road opening in early 2025.
- Online sales accounted for 38% of total hardware revenue in Q1 2025.
- The Apple Store app saw a 14% increase in downloads, totaling over 108 million installs globally.
- Average order value through Apple’s e-commerce platforms increased to $1,036.
- Apple’s click-and-collect service now operates in over 90% of its physical retail locations.
- Retail foot traffic in U.S. flagship stores grew by 12% year-over-year.
- Apple Trade In program processed over 12 million devices, with an average payout of $312 per device.
- The Apple Store app now supports dynamic bundle pricing, driving a 7% higher conversion rate.
- Apple’s AR-based shopping experience is used by over 1.8 million users monthly.
- Customer satisfaction ratings for in-store experiences stand at 98%, among the highest in the tech retail industry.
Apple’s Global Market Size Forecast
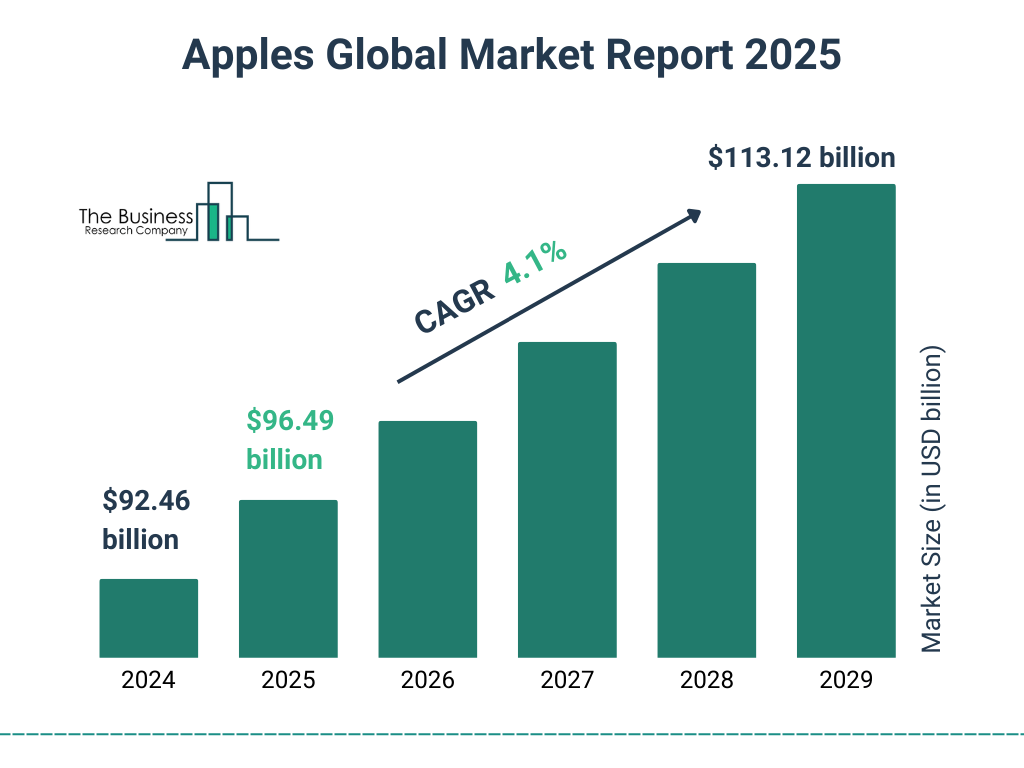
- In 2024, Apple’s global market size was valued at $92.46 billion.
- It is expected to grow to $96.49 billion in 2025.
- The market is projected to continue rising, reaching $113.12 billion by 2029.
- This growth represents a CAGR of 4.1% over the five-year period.
Regional Market Share Analysis
- In Q1 2025, Apple holds a 57% smartphone market share in the United States, maintaining leadership in the premium segment.
- China accounted for 16% of Apple’s total revenue, with improved sales following local partnerships.
- Apple’s presence in India surged with a 34% YoY increase in iPhone shipments, supported by new retail locations.
- In Europe, Apple now commands 27.1% of the smartphone market, driven by regulatory compliance and eco-conscious models.
- Brazil remains Apple’s most expensive market, with average iPhone prices 46% higher than the U.S. MSRP.
- In Japan, Apple enjoys nearly 48% market share, due to regional carrier bundles and loyalty.
- The Middle East showed 21% growth in iPad sales, with the UAE and Saudi Arabia leading the demand.
- Apple’s share in Southeast Asia continues to rise, with Vietnam and Indonesia up by 17% collectively.
- Canada’s Apple Watch penetration hit 22% of smartphone users, an all-time high.
- In Australia, Apple Pay accounts for 58% of all contactless mobile transactions.
Environmental and Sustainability Stats
- Apple now uses 100% recycled aluminum in all MacBook Air and iPad models.
- As of Q1 2025, 78% of Apple’s global operations are powered by renewable energy.
- The company has reduced its product carbon footprint by 11%, achieving a 38.4kg average across devices.
- Apple eliminated over 2.1 million metric tons of carbon emissions through supply chain improvements.
- Over 78% of all Apple packaging is now made from recycled or responsibly sourced fibers.
- Apple’s Daisy robot has now dismantled 56 million devices, recovering rare-earth materials efficiently.
- Carbon-neutral product lines now include the entire Apple Watch series.
- The Apple Supplier Clean Energy Program has helped suppliers avoid over 14.3 million metric tons of CO₂e.
- Apple aims to achieve carbon neutrality across its supply chain by 2030, and remains on track.
- The iPhone 15 line shipped without plastic screen protectors or wall adapters, cutting 600 metric tons of plastic waste.
- Over 30 Apple suppliers have committed to operating on 100% clean energy by the end of 2025.
iPhone Market Share by Region
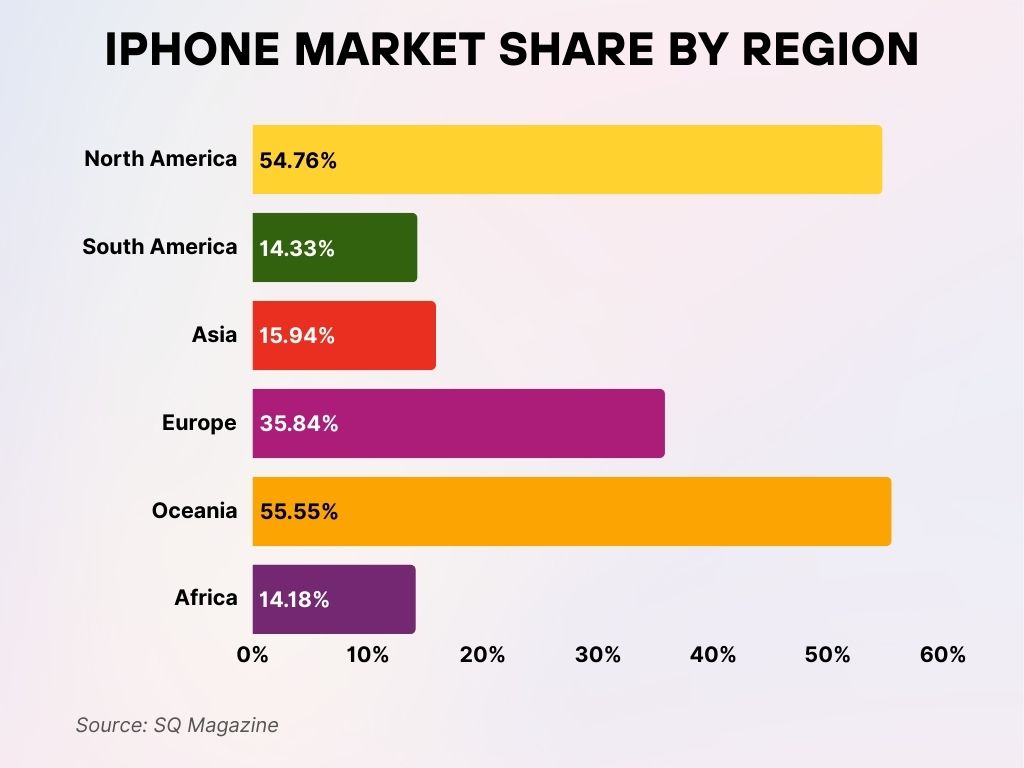
- Worldwide, the iPhone holds a 27.60% market share.
- Oceania leads globally with the highest iPhone market share at 55.55%.
- North America follows closely behind with a strong 54.76% share.
- In Europe, the iPhone captures 35.84% of the market.
- Asia shows moderate adoption with a 15.94% market share.
- South America trails slightly behind at 14.33%.
- Africa reports the lowest regional share, with only 14.18% of the market.
R&D and Innovation Spending
- Apple’s R&D expenditure reached $32.9 billion, accounting for 7.2% of total revenue, its highest allocation yet.
- A major portion of this spend is directed toward Apple Silicon, AI integration, and spatial computing via Apple Vision Pro.
- In 2025, Apple established two new AI research centers, one in Austin, Texas, and another in Zurich, Switzerland.
- The company now holds over 78,000 active patents globally, with 5,000+ filed in the past 12 months.
- Apple’s annual AI training compute usage grew by 3.5x YoY, reflecting intensified focus on machine learning.
- ARKit adoption in developer apps rose by 21%, indicating growing support for Apple’s spatial computing framework.
- Internal reports show that 60% of R&D staff now work on projects involving AI, neural engines, or mixed reality.
- Apple’s joint ventures with universities led to the publication of 240+ peer-reviewed papers.
- Over $1.9 billion was spent solely on health innovation, including biometric sensors and ambient monitoring tech.
- Apple invested $3.4 billion into chip manufacturing capacity expansion, supporting the M-series and new neural cores.
- The company is quietly developing a quantum research initiative, slated for pilot trials in 2026.
Stock Performance and Market Valuation
- Apple’s market capitalization stands at $2.86 trillion as of Q1 2025, maintaining its lead in global equity valuation.
- The stock opened in 2025 at $197 per share, climbing 8.4% YTD as of May.
- Apple authorized an additional $80 billion stock buyback, bringing the total repurchase program to $570 billion since inception.
- Dividend payout in Q1 2025 was $0.24 per share, marking a steady quarterly yield.
- Institutional investors now own 61% of AAPL stock.
- Apple remains part of the Dow Jones Industrial Average, Nasdaq-100, and S&P 500, with heavy ETF exposure.
- Apple’s price-to-earnings (P/E) ratio currently stands at 31.2, reflecting high investor confidence.
- Earnings per share (EPS) reached $6.48 in the trailing twelve months.
- Retail investor activity grew on platforms like Robinhood, with Apple among the top 3 most traded stocks.
- Over $1.5 trillion in global funds have direct exposure to Apple equity through index allocations.
Apple Revenue Breakdown by Product
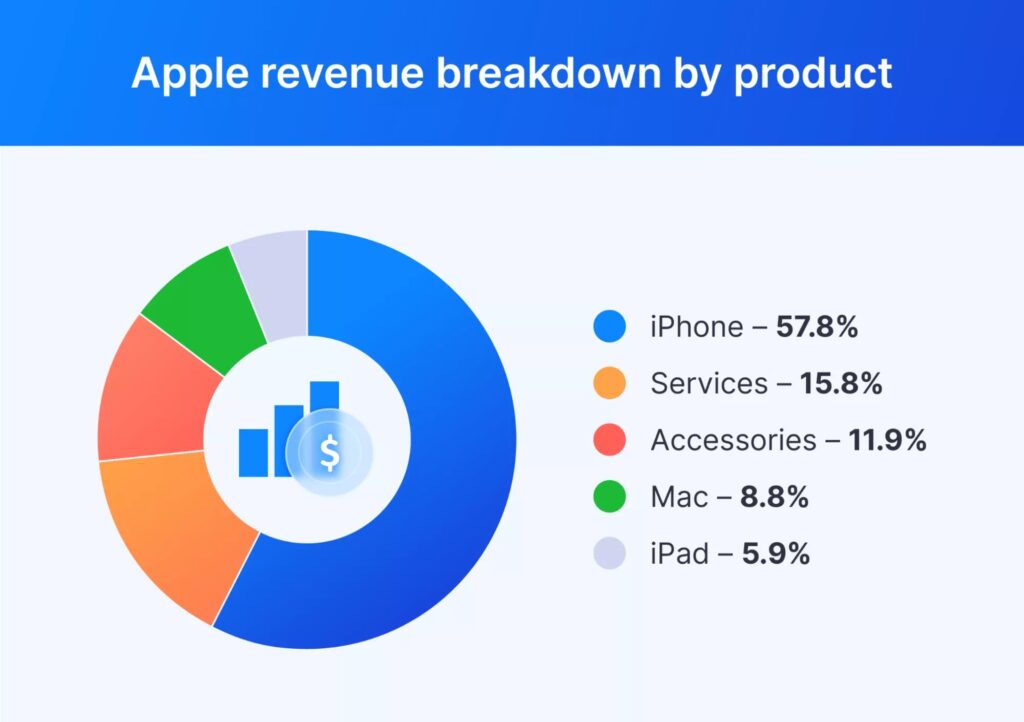
- The iPhone dominates Apple’s revenue stream, contributing 57.8% of total earnings.
- Services are the second-largest segment, accounting for 15.8% of revenue.
- Accessories, including wearables and peripherals, bring in 11.9%.
- Mac computers contribute 8.8% to the overall revenue.
- The iPad accounts for the smallest share at 5.9%.
App Store Revenue and Developer Earnings
- In the past 12 months, App Store developers earned over $138 billion, marking a 13% YoY increase.
- Over 650 million unique users now access the App Store monthly.
- Games account for 53% of all App Store revenue, with casual and mid-core titles dominating.
- Subscriptions contribute 34% of App Store purchases, led by productivity and fitness apps.
- Small developers (earning <$1 million/year) saw a 28% YoY growth, supported by Apple’s Small Business Program.
- Over 180,000 new apps were published in the App Store between May 2024 and May 2025.
- App Store Review times improved, with 94% of apps reviewed within 24 hours.
- Apple’s commission structure now supports a 15% revenue share for most developers under $1 million.
- In-app purchases contributed over $60 billion, representing the largest single revenue stream.
- Apple recently expanded its alternative payment method pilot programs in the EU, under new regulatory compliance.
Recent Developments
- Apple Vision Pro launched globally in March 2025, setting a new standard for immersive computing.
- Apple’s AI assistant enhancements in iOS 18 now support contextual memory and real-time translation.
- In 2025, Apple began pilot programs for foldable iPhones, expected to launch commercially in late 2026.
- Apple has partnered with OpenAI and Google DeepMind for responsible AI integration within Siri and iWork apps.
- The company unveiled its first carbon-neutral store in Munich, Germany, as part of its global sustainability roadmap.
- Apple Pay later expanded to seven new countries, including South Korea and Chile.
- A new satellite-powered SOS service for Watch and iPhone now covers 22 countries.
- Apple introduced VisionOS, a dedicated operating system for its mixed reality platform.
- Apple Podcasts+ now hosts over 1.2 million exclusive audio episodes, attracting 14 million subscribers.
- New Apple silicon-powered data centers are now live in North Carolina and Ireland, optimizing cloud performance.
- The company is rumored to be working on an electric vehicle (EV), with concept trials internally scheduled for 2026.
Conclusion
Apple’s momentum in 2025 reflects more than just technological excellence, it reveals a well-synchronized global brand adapting to both innovation and regulation. From redefining personal computing with Apple Silicon to entering the immersive tech arena with Vision Pro, Apple continues to blend performance, ecosystem, and ethics in one tight package.
The data doesn’t lie: strong retention rates, record-breaking services revenue, and industry-leading margins showcase a company well-aligned with the future. As Apple leans deeper into AI, health, and sustainability, it isn’t just setting trends, it’s setting standards.

