When Lisa Johnson opened her bakery in Chicago in early 2024, she didn’t expect that one viral tweet about her pistachio cruffins would transform her side hustle into a full-fledged business. But that’s exactly what happened, just a single post on X (formerly Twitter) brought in thousands of new followers, hundreds of orders, and local media coverage.
Lisa’s story isn’t unique. Twitter, or X as it’s now branded, continues to serve as a digital megaphone for individuals, influencers, brands, and even governments. And while its name may have changed, the platform’s impact is still enormous.
In 2025, Twitter isn’t just about what’s trending, it’s about how users interact, spend, and shape conversations. From political discourse to viral memes, the stats behind Twitter paint a vivid picture of a platform that refuses to fade into the background. Let’s dive into the latest Twitter statistics to understand how this evolving platform is shaping the digital landscape.
Editor’s Choice
Here are some standout Twitter (X) statistics for 2025 that you don’t want to miss:
- Twitter currently has over 610 million registered users worldwide.
- There are 259 million daily active users (DAUs) on Twitter in 2025.
- The United States remains the largest Twitter market, with over 91 million users.
- Gen Z users now make up nearly 40% of Twitter’s global audience.
- Twitter’s rebrand to X hasn’t slowed revenue. Q1 2025 revenue rose by 13% year-over-year.
- Elon Musk’s own account is the most followed on the platform with over 161 million followers.
- The average user now spends 29 minutes per day on Twitter, up from 24 minutes in 2024.
- Twitter Blue subscribers reached 3.6 million in early 2025.
- Video content makes up 42% of all tweets with media attachments.
- Tweets with hashtags receive 21% more engagement than those without.
Why People Use X (formerly Twitter)
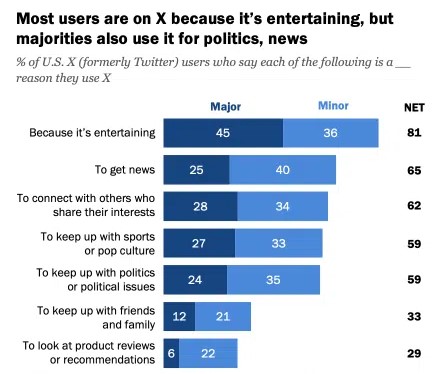
- 81% use X because it’s entertaining – This is the top reason, with 45% citing it as a major reason and 36% as a minor one.
- 65% use X to get news – 25% say it’s a major reason, while 40% say it’s a minor reason.
- 62% use X to connect with others who share their interests – 28% major, 34% minor.
- 59% use it to keep up with sports or pop culture – Driven by 27% major and 32% minor responses.
- 58% use X for political content – 24% cite this as a major reason, with 35% as minor.
- 33% use it to keep up with friends and family – Just 12% major, 21% minor.
- 29% look at product reviews or recommendations – Lowest category with 6% major and 22% minor.
Total Number of Twitter Users
- As of Q2 2025, Twitter has surpassed 610 million total registered users globally.
- This reflects a 4.8% increase from the 582 million users reported in mid-2024.
- The United States accounts for the largest user base with 91.2 million users, or about 15% of global users.
- India holds second place with 76 million users, followed by Japan with 61 million.
- Brazil and the United Kingdom round out the top five with 35 million and 26 million users, respectively.
- Twitter saw a surge of 11 million new sign-ups in Q1 2025, driven by product launches and global events.
- The platform gained 1.5 million users from the gaming community in early 2025, following X’s partnership with major game publishers.
- Active user growth has remained steady in Africa, with a 6.2% increase year-over-year in countries like Nigeria and South Africa.
- Europe’s user count plateaued slightly, staying around 92 million, influenced by stricter data privacy laws.
- Twitter Lite (a lighter version of the app) helped drive adoption in emerging markets, especially Southeast Asia.
Twitter Daily and Monthly Active Users
- Twitter boasts 259 million daily active users (DAUs) as of April 2025.
- This marks a 6.6% increase from 243 million DAUs recorded in April 2024.
- Monthly active users (MAUs) reached 516 million, compared to 487 million last year.
- In the U.S. alone, Twitter has 31 million daily active users.
- Android users make up 58% of daily activity, while iOS accounts for 35%.
- Web browser usage for DAUs declined slightly to 7%, indicating growing mobile dependency.
- Approximately 72% of DAUs interact with tweets via likes or retweets at least once daily.
- Weekend activity spikes by 14%, especially on Sundays during live events or sports.
- The average DAU interacts with 35 tweets per day, a figure that’s up from 31 last year.
- Peak usage times are between 9 a.m. and 12 p.m. local time, regardless of region.
Top Twitter Alcohol-Related Hashtags by Engagement Rate
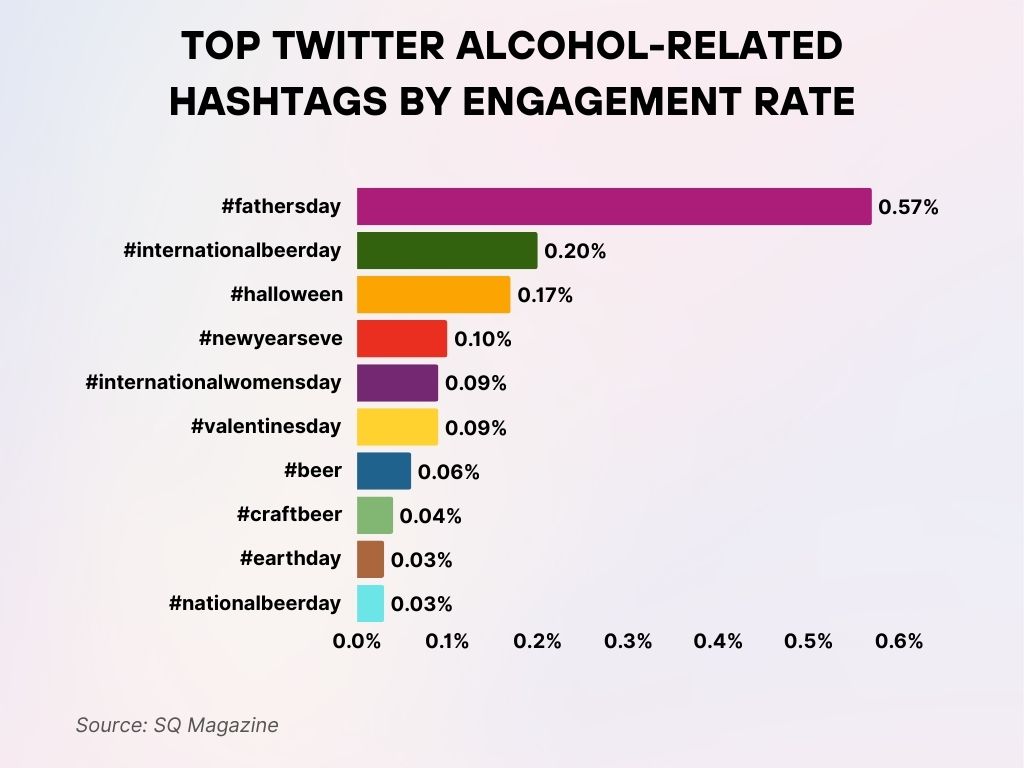
- #fathersday leads with a 0.57% engagement rate, making it the most effective hashtag among alcohol brands on Twitter.
- #internationalbeerday ranks second at 0.20%, showing strong audience interaction around beer-themed celebrations.
- #halloween follows with a 0.17% engagement rate, indicating seasonal campaigns drive solid engagement.
- #newyearseve earns 0.10%, reflecting decent engagement tied to festive alcohol promotions.
- #internationalwomensday and #valentinesday both see 0.09%, highlighting moderate success for campaigns aligning with these occasions.
- #beer garners a 0.06% engagement rate, lower despite being a general keyword, possibly due to saturation.
- #craftbeer attracts 0.04%, suggesting niche appeal but lower overall interaction.
Most Popular Twitter Accounts
- Elon Musk remains the most followed account on Twitter, with 161 million followers.
- Barack Obama ranks second with 134 million followers.
- Justin Bieber, once the most followed celebrity, now ranks third with 114 million.
- Rihanna leads among female artists with 110 million followers.
- Narendra Modi, India’s Prime Minister, is the most followed political leader with 98 million followers.
- The NASA account saw a surge to 88 million followers following the 2025 solar eclipse coverage.
- Taylor Swift is the most followed female artist after Rihanna, with 103 million followers.
- Among brands, YouTube leads with 83 million followers, followed by CNN with 77 million.
- Cristiano Ronaldo is the top athlete on Twitter with 94 million followers.
- Influencer account MrBeast surpassed 50 million followers, with high engagement on giveaway tweets.
Average Time Spent on Twitter
- As of 2025, the average user spends 29 minutes per day on Twitter, up from 24 minutes in 2024.
- Power users (top 10% in activity) spend nearly 58 minutes daily on the platform.
- Among Gen Z users, the average time is higher at 34 minutes per day.
- U.S. users spend slightly more time, averaging 31 minutes daily, compared to the global average.
- Time spent on Twitter peaks during commute hours (8–9 a.m. and 5–6 p.m.), suggesting mobile-first usage.
- Over 68% of users check Twitter multiple times per day.
- Desktop users tend to have shorter sessions but consume more tweets per visit than mobile users.
- Twitter Spaces has increased session duration by an average of 7 minutes for those who join live conversations.
- Users engaging with Threads (long-form posts) spend 12% more time per visit than those engaging only with short tweets.
- Average session length has grown by 15% since the rebrand to X, showing increased engagement.
Who Uses X (Twitter) in the U.S. by Demographic Breakdown
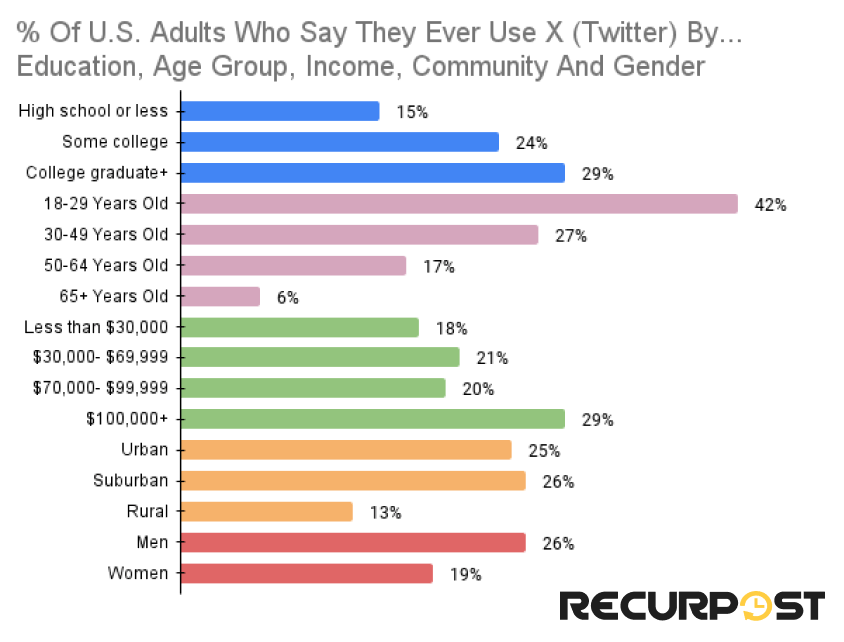
- 42% of U.S. adults aged 18–29 use X, the highest among all age groups.
- 29% of college graduates and those earning $100,000+ annually are active on X.
- 27% of adults aged 30–49 report using X, followed by 17% of those aged 50–64 and only 6% of those 65+.
- 26% of both suburban residents and men say they use X.
- 25% of urban residents are X users, compared to just 13% in rural areas.
- Education impacts usage: 15% with high school or less, 24% with some college, and 29% with a college degree use X.
- Among income groups, 21% earning $30K–$69K, 20% earning $70K–$99K, and 18% earning under $30K use X.
- 19% of women report using X, notably lower than men.
Twitter Revenue
- Twitter generated $6.4 billion in global revenue in 2024, with projections pushing $7.2 billion for 2025.
- Ad revenue remains the primary source, making up approximately 84% of total income.
- The U.S. market contributed $3.1 billion to total revenue in 2024.
- Subscription revenue is expected to exceed $800 million by the end of 2025.
- Twitter’s Q1 2025 earnings showed a 13% year-over-year increase, signaling stronger monetization.
- In-app purchase revenue (like Super Follows and Tips) reached $120 million, a 40% jump from 2024.
- Twitter’s partnership with Shopify added $160 million in commerce-driven ad revenue in 2025.
- Twitter’s cost-per-click (CPC) for promoted tweets increased to $1.27, up from $0.94 in 2024.
- Revenue from international markets grew by 11%, largely fueled by expansion in Asia-Pacific.
- Corporate accounts using premium features contributed $210 million in annual revenue.
X (Twitter) Business Statistics
- Over 92% of Fortune 500 companies maintain an active presence on Twitter.
- Small businesses account for 38% of all business-related tweets on the platform.
- Verified business accounts grew by 19% in the past year.
- The average business account tweets 3.5 times per day.
- Brand response rate on Twitter is 47%, higher than on Facebook or Instagram.
- Twitter now supports in-platform storefronts; over 28,000 brands have adopted this feature.
- Tweets that include customer support responses receive 60% higher engagement.
- Twitter remains the top platform for B2B marketing, with 72% of B2B marketers reporting regular use.
- Business tweets that include video receive 28% more engagement than text-only tweets.
- Customer service response time via Twitter DM has dropped to an average of 3.2 hours, down from 4.6 hours in 2024.
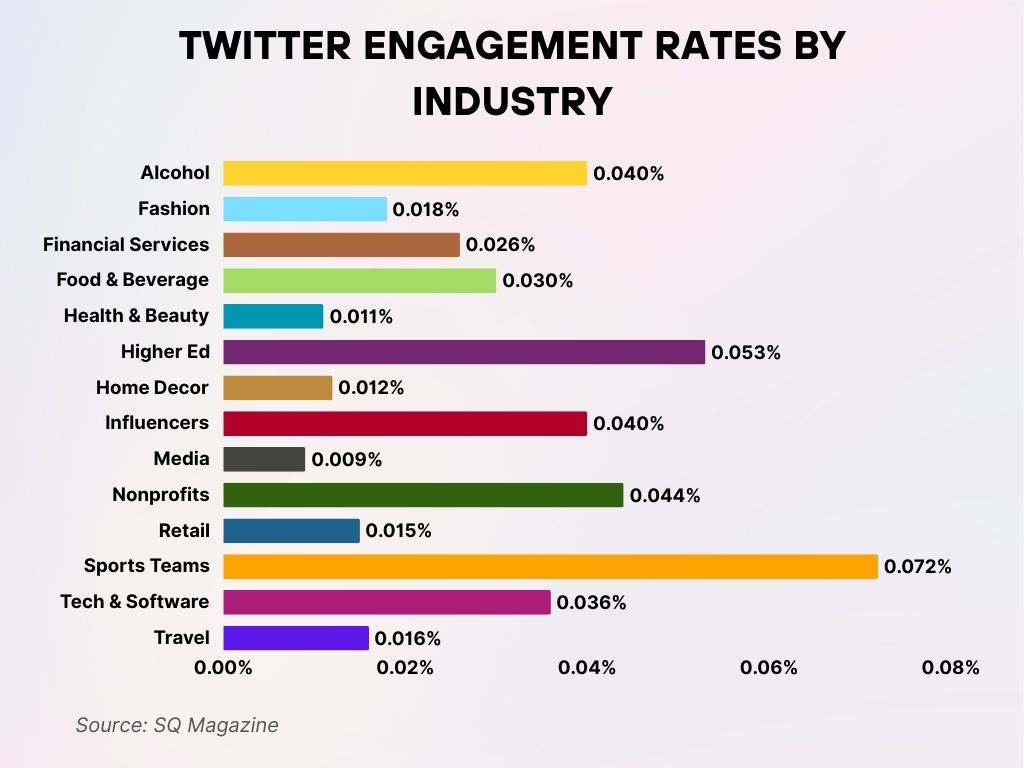
Twitter Engagement Rates by Industry
- The median engagement rate across all industries is 0.029% per tweet.
- Sports Teams lead all industries with a 0.072% engagement rate, the highest in the chart.
- Higher Ed follows with 0.053%, showing strong audience interaction in the education sector.
- Nonprofits (0.044%) and Alcohol brands (0.040%) also perform above the industry median.
- Influencers match Alcohol at 0.040%, indicating effective engagement with personal brands.
- Tech & Software earns 0.036%, slightly above the median.
- Food & Beverage (0.030%) barely edges above the median line.
- Financial Services (0.026%) and Fashion (0.018%) trail behind.
- Health & Beauty (0.011%) and Media (0.009%) show the lowest engagement rates.
- Retail (0.015%) and Travel (0.016%) also fall below average in engagement.
- Home Decor (0.012%) ranks low, showing limited interaction.
X (Twitter) Ads Statistics
- Twitter’s global ad reach stands at 551 million users as of 2025.
- Cost-per-engagement (CPE) for Twitter ads has increased to $0.58, up from $0.49 in 2024.
- Carousel Ads generate 35% more clicks than single-image ads.
- Video ads now account for 64% of Twitter’s ad revenue.
- Twitter’s ad revenue in the U.S. grew by 9.4% year-over-year.
- Businesses running Twitter Ads campaigns see an average 3.2x return on ad spend (ROAS).
- Twitter Ads Manager now offers AI-driven targeting, increasing campaign efficiency by 18%.
- Political ad spending in the U.S. is expected to top $420 million by the end of the 2025 election cycle.
- The average click-through rate (CTR) for Twitter ads is 1.8%, compared to 1.3% on LinkedIn.
- Twitter ads with emojis in the copy perform 15% better in engagement metrics.
Twitter (X) Influencer Statistics
- Influencers with over 1 million followers have an average engagement rate of 1.7%.
- Nano-influencers (1,000–10,000 followers) see the highest engagement, averaging 4.6%.
- Influencer partnerships on Twitter have increased by 28% since 2024.
- Sponsored tweet rates vary widely, with micro-influencers charging an average of $120 per post.
- Tech influencers dominate the platform, making up 32% of all sponsored content.
- Influencers using Threads (long-form tweets) see a 24% higher retweet rate.
- U.S.-based influencers represent 46% of all sponsored activity on Twitter.
- The top 5 influencer categories are: Tech, Gaming, Fashion, Personal Finance, and Politics.
- Verified influencers report a 41% higher engagement than unverified peers.
- AI-generated influencers have emerged in 2025, and their posts are getting nearly 3x more impressions than traditional influencer posts.
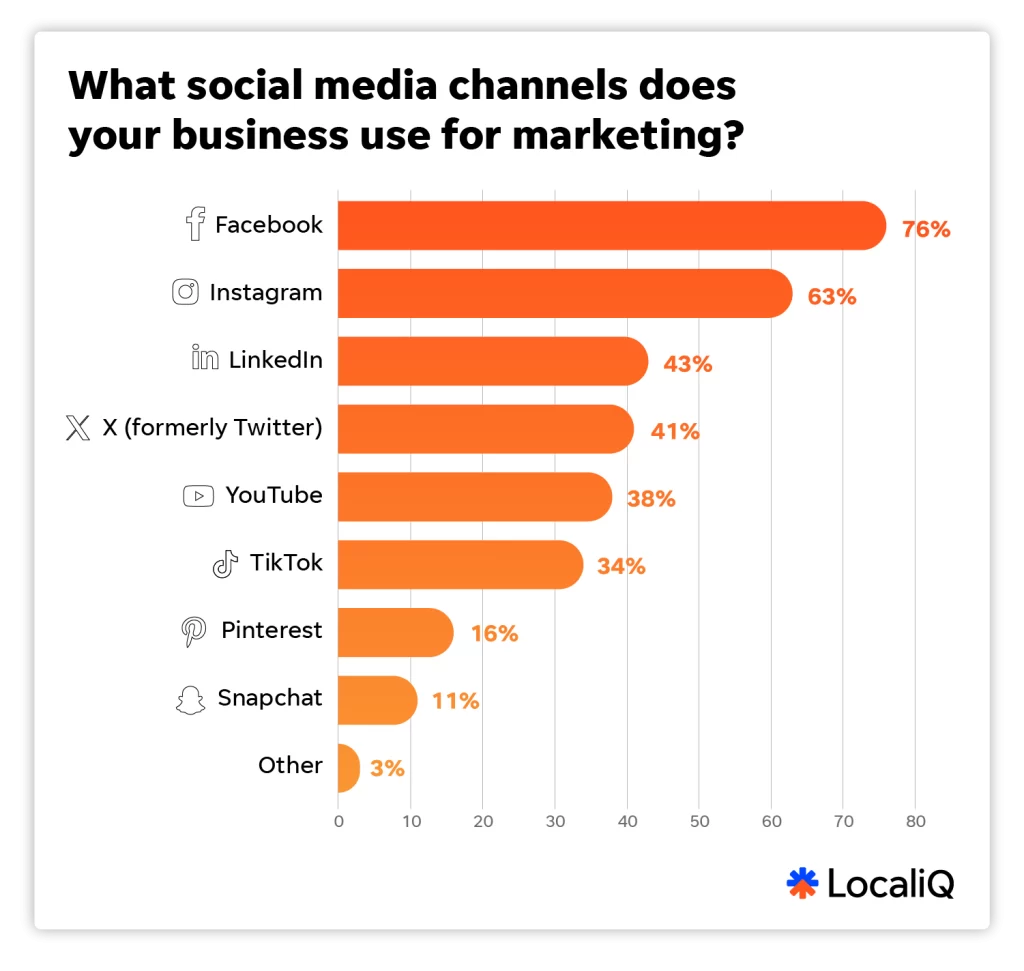
Most Used Social Media Platforms for Business Marketing
- Facebook dominates at 76%, making it the most-used platform for business marketing.
- Instagram ranks second with 63%, showing strong visual content appeal for brands.
- LinkedIn is used by 43% of businesses, favored for B2B and professional marketing.
- X (formerly Twitter) is chosen by 41%, showing its continued relevance despite rebranding.
- YouTube follows with 38%, indicating the importance of video marketing.
- TikTok is used by 34%, highlighting its growing role in reaching younger audiences.
- Pinterest (16%) and Snapchat (11%) lag behind, showing lower adoption among businesses.
- Only 3% use other platforms, showing concentration around major networks.
Top Trending Topics and Hashtags
- In Q1 2025, the most tweeted hashtag was #AIeverywhere, appearing in over 14.3 million tweets.
- #SuperBowl2025 trended for 72 hours straight, generating 8.5 million tweets globally.
- #Oscars2025 saw a 22% increase in engagement over last year, thanks to real-time backstage content.
- Political hashtag #ElectionWatch trended in 43 U.S. states during the primary season.
- The most used emoji in hashtags was 🔥, appearing in 3.1 million posts in March alone.
- Hashtags tied to climate change, like #ActOnClimate, rose by 17% year-over-year.
- #CryptoCrash dominated fintech conversations, with over 6 million tweets during a single 3-day window in February.
- Celebrity death tributes accounted for 9% of trending content in the first quarter.
- Tweets featuring custom-branded hashtags increased by 26%, led by brands in tech and entertainment.
- Top regional hashtags included #MetGala2025, #MarchMadness, and #CES2025.
Twitter Engagement Rates and Interaction Metrics
- The average tweet engagement rate in 2025 is 0.045%, slightly down from 0.048% in 2024.
- Tweets with images receive 2.3x more engagement than those without media.
- Tweets with videos see 10x more shares than text-only posts.
- Including hashtags boosts engagement by 21%, but using more than two hashtags can reduce it.
- Engagement peaks on Wednesdays and Thursdays, especially between 11 a.m. and 1 p.m. local time.
- Replies have increased in volume by 18% year-over-year, showing stronger two-way communication.
- Tweets under 100 characters have 17% higher engagement than longer tweets.
- The average user likes 23 tweets per day, a 6% rise from 2024.
- Retweets account for 31% of all user interactions on the platform.
- Threads (multi-tweet posts) generate 2.4x more engagement than standalone tweets.
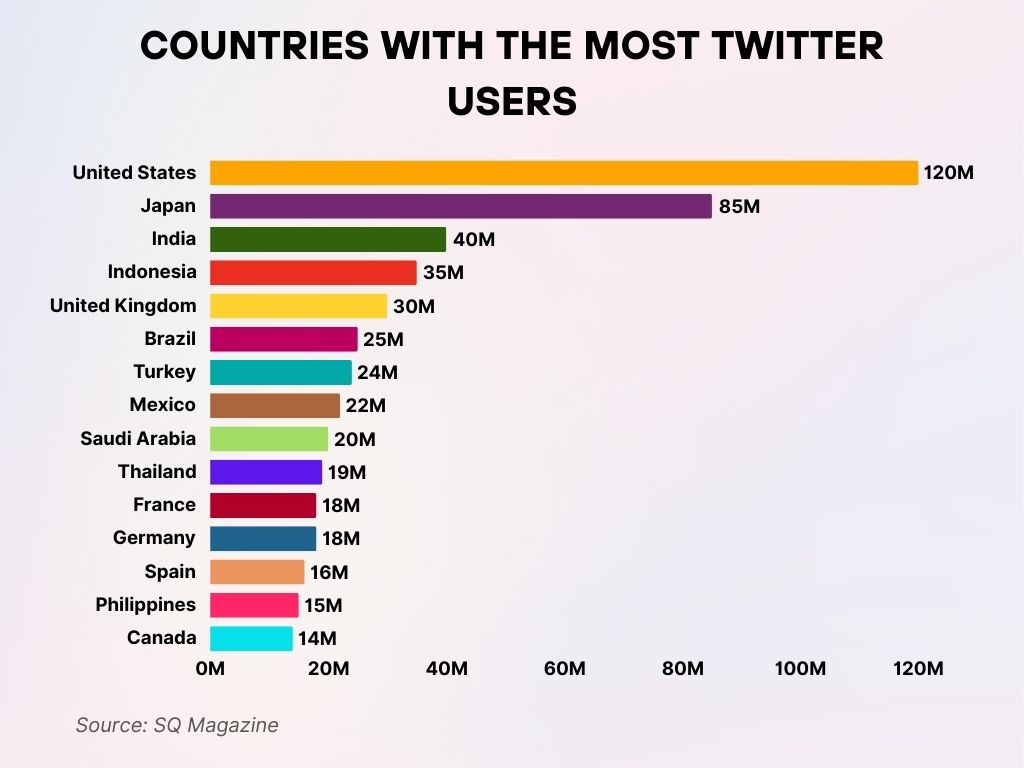
Countries with the Most Twitter Users
- The United States leads with approximately 120 million users, making it the largest Twitter market globally.
- Japan ranks second with around 85 million users, showing Twitter’s strong presence in Asia.
- India has an estimated 40 million users, placing it third in global usage.
- Indonesia follows closely with 35 million Twitter users.
- The United Kingdom has about 30 million users, leading Twitter adoption in Europe.
- Brazil and Turkey each have over 24 million users, reflecting high engagement in Latin America and the Middle East.
- Mexico (22M) and Saudi Arabia (20M) also have sizable Twitter communities.
- Thailand, France, and Germany are nearly tied with around 18–19 million users each.
- Spain has approximately 16 million users, while the Philippines follows with 15 million.
- Canada rounds out the list with 14 million users, showing steady North American adoption.
Mobile vs. Desktop Usage Statistics
- As of 2025, 89% of Twitter usage occurs on mobile devices.
- Desktop usage has dropped to just 11%, continuing its annual decline.
- Android leads mobile traffic with 51%, while iOS makes up 38%.
- Twitter Lite is responsible for 9% of all mobile traffic, primarily from developing countries.
- Desktop users tend to stay longer per session, 9.8 minutes vs. 7.3 minutes on mobile.
- Tweets posted from mobile devices account for 92% of total daily tweet volume.
- Notifications on mobile drive 67% of user log-ins, especially among Gen Z users.
- Mobile-first users are 2.5x more likely to engage with Twitter Spaces and video content.
- App performance upgrades in early 2025 improved Android load times by 22%.
- Mobile usage is highest in Latin America and Southeast Asia, where mobile internet is more accessible than broadband.
Twitter Blue and Subscription Metrics
- Twitter Blue subscribers total 3.6 million globally as of April 2025.
- The U.S. leads with 1.2 million paid subscribers, followed by the UK and India.
- Subscription revenue is projected to hit $820 million by year-end.
- Verified checkmarks now appear on 5.9% of total accounts, largely driven by Twitter Blue.
- Engagement among Twitter Blue users is 38% higher than free users.
- Blue subscribers post 2.8x more frequently and are more likely to use advanced features like long-form tweets.
- Twitter Blue subscribers get priority ranking in replies and searches, influencing content visibility.
- The subscription tier offering ad-free timelines saw a 61% increase in adoption over the past six months.
- Businesses can now link Twitter Blue to branded accounts, improving reach and click-through rates.
- Premium tools like Bookmark Folders and Undo Tweet are used by over 70% of Blue users weekly.
Twitter Video and Multimedia Usage Trends
- 42% of all tweets now include multimedia (video, image, or GIF).
- Native video uploads are up 27% year-over-year, driven by higher mobile bandwidth.
- Twitter videos average 2.6 billion views per day across the platform.
- The most common video length is 15–30 seconds, optimized for scroll-based consumption.
- Tweets with video receive 10x more shares and 2.5x more replies than text-only tweets.
- Twitter Spaces, the platform’s audio component, has seen 34% growth in participation since 2024.
- Twitter’s algorithm now prioritizes video tweets, increasing exposure by 18% on average.
- Tweets with embedded YouTube links underperform native Twitter videos by 37% in engagement.
- Brands using short-form Twitter videos report 41% higher conversion rates.
- In 2025, multimedia tweets are responsible for 55% of total tweet impressions, a record high.
Recent Developments in Twitter Features and Platform Changes
- The platform’s rebrand to X is now fully integrated across all web and mobile interfaces.
- A new creator monetization program rolled out in early 2025 has paid out over $45 million so far.
- AI-powered moderation tools now detect and limit spam with 94% accuracy.
- Twitter introduced Topic Subscriptions, allowing users to follow themes rather than just accounts.
- The long-form post limit has expanded to 25,000 characters, competing directly with blogging platforms.
- A new Tweet Edit History feature was added, allowing transparency for modified tweets.
- Twitter Shopping integrations now support checkout within tweets, boosting ecommerce potential.
- API access tiers were revised, introducing stricter limits on free developer usage.
- The Communities feature has grown, with over 14 million users participating in topic-based groups.
- Twitter also announced end-to-end encryption for direct messages, finally matching competing platforms.
Conclusion
Twitter, now X, continues to evolve faster than many predicted after its high-profile rebrand. With growing user activity, more monetization options for creators and brands, and deeper engagement driven by multimedia content, it’s clear the platform isn’t fading, it’s adapting.
From rising subscription adoption to the integration of AI and long-form content, Twitter is carving out new ways to stay culturally relevant in an ever-changing digital world. Whether you’re a casual scroller, a brand strategist, or a political analyst, the numbers show that Twitter remains a dynamic, data-driven space where influence, community, and conversation collide.

