In 2025, technology continues to weave itself into the fabric of our daily lives. From the moment we wake up to the glow of our smartphones to the seamless connectivity that powers our work and leisure, digital tools have become indispensable. This article delves into the latest statistics on global technology usage, offering insights into how our world is becoming increasingly interconnected.
Editor’s Choice
- 5.64 billion people worldwide are using the internet as of April 2025, representing 68.7% of the global population.
- The global smartphone user base is projected to reach 7.34 billion by the end of 2025.
- In the United States, 98% of adults own a mobile phone, with 91% owning a smartphone.
- 72.6% of smartphone owners globally rely on their devices as their sole means of accessing the internet.
- Global technology spending is expected to grow by 5.6% in 2025, reaching $4.9 trillion.
- The global digital transformation market is projected to expand to $1.0098 trillion by 2025.
- The United States has 311.3 million internet users, making it the third-largest online population globally.
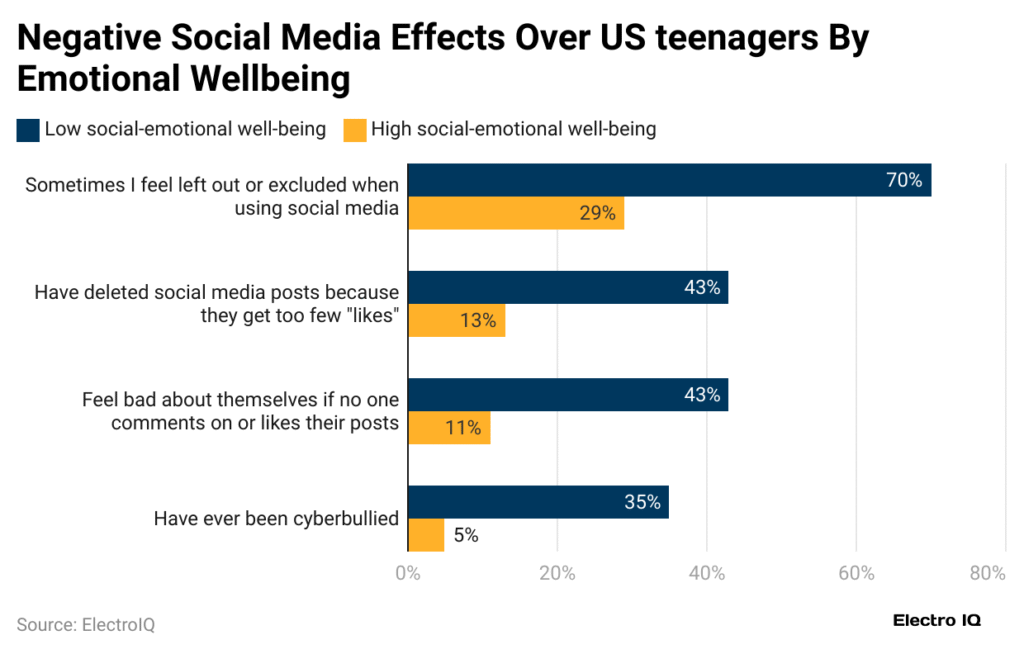
Negative Social Media Effects Among US Teenagers by Emotional Well-Being
- 70% of teens with low social-emotional well-being reported feeling left out or excluded when using social media, compared to only 29% of teens with high well-being.
- 43% of low well-being teens said they deleted posts due to receiving too few “likes”, versus just 13% of their high well-being peers.
- 43% of teens with low emotional well-being felt bad about themselves if no one interacted with their posts, while only 11% of those with high emotional well-being felt the same.
- 35% of low well-being teens reported being cyberbullied, compared to a much lower 5% among teens with high emotional well-being.
Global Technology Adoption Rates
- The number of internet users worldwide has reached 5.64 billion in 2025, marking a 3.67% year-over-year increase.
- China leads with 1.1 billion internet users, followed by India with 881.3 million, and the United States with 311.3 million.
- The global digital transformation market is expected to grow to $1.0098 trillion by 2025, up from $469.8 billion in 2020.
- Global technology spending is projected to reach $4.9 trillion in 2025, a 5.6% increase from the previous year.
- Emerging economies are experiencing rapid technology adoption, with countries like India and Brazil investing heavily in digital infrastructure.
- The global AI adoption rate is expected to surge by 20%, reaching 378 million users in 2025.
- The United States remains a leader in technology investment, with significant growth in the AI and cloud computing sectors.
Internet and Broadband Usage Trends
- As of January 2025, 5.5 billion people worldwide are internet users, accounting for 69% of the global population.
- The average internet speed in the U.S. has increased, with more households accessing high-speed broadband connections.
- 47% of Americans bundle their internet with mobile or cable services, optimizing costs and connectivity.
- Rural areas in England and Wales are set to receive high-speed broadband through a £289 million government-funded initiative.
- The digital divide persists, with urban areas having higher internet penetration rates compared to rural regions.
- In the U.S., 96% of adults use the internet, with usage rates varying across different income and education levels.
- The global average daily time spent online per user has increased, reflecting the growing reliance on digital platforms for work and entertainment.
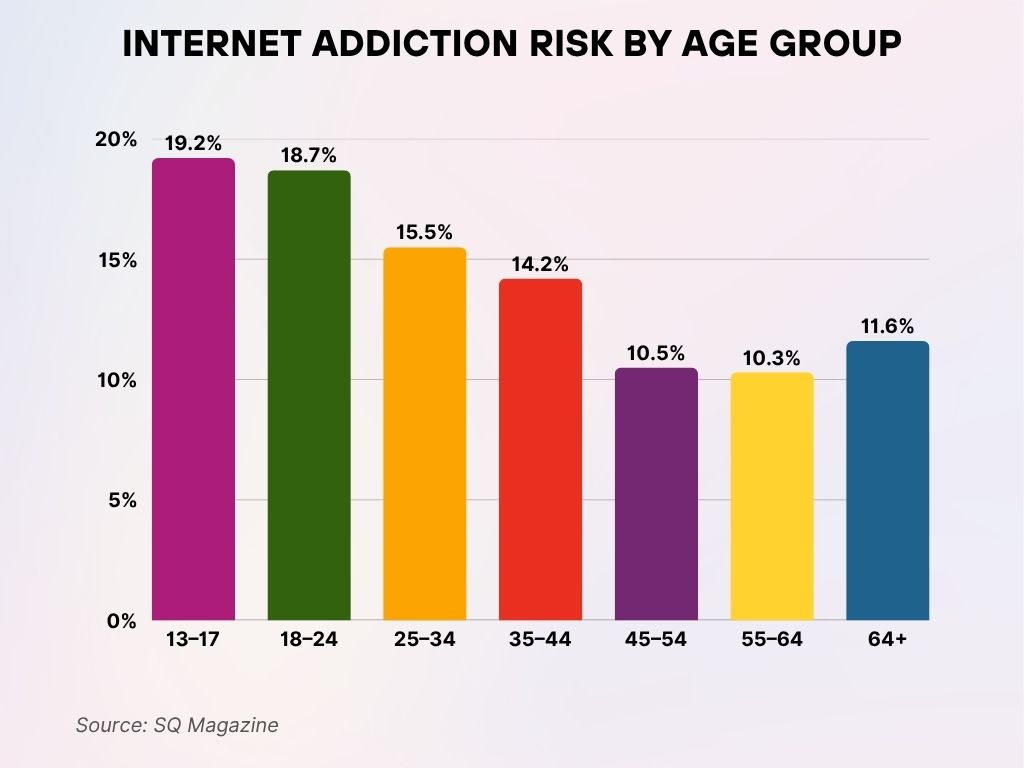
Internet Addiction Risk by Age Group
- Teens aged 13–17 have the highest risk of internet addiction, accounting for 19.2% of the adjusted total.
- Young adults aged 18–24 closely follow, making up 18.7% of the internet addiction risk.
- Individuals aged 25–34 contribute 15.5%, indicating elevated risk levels in early adulthood.
- The 35–44 age group represents 14.2%, showing a gradual decline in risk with age.
- Those aged 45–54 account for 10.5% of the total risk.
- Adults aged 55–64 represent 10.3%, indicating lower but still notable susceptibility.
- Seniors aged 64 and above make up 11.6% of the internet addiction risk, slightly higher than some middle-aged groups.
Mobile Device Penetration Statistics
- The global smartphone market is projected to grow by 2.3% in 2025, with significant contributions from emerging markets.
- In the U.S., 98% of adults own a mobile phone, and 91% own a smartphone, indicating near-saturation levels.
- 72.6% of smartphone owners worldwide use their devices as their primary means of accessing the internet.
- The number of smartphone users globally is expected to reach 7.34 billion by the end of 2025.
- Mobile commerce is on the rise, with 1.65 billion people shopping via mobile phones, accounting for 30% of the digital population.
- The average time spent on mobile devices continues to increase, with users engaging in various activities such as streaming, gaming, and social media.
- The adoption of 5G technology is accelerating, enhancing mobile internet speeds and enabling new applications in various sectors.
Social Media Platform Usage Patterns
- As of 2025, 5.04 billion people globally are active social media users, accounting for 62.3% of the world’s population.
- The average daily time spent on social media is 2 hours and 21 minutes.
- 97.3% of connected adults use at least one social network or messaging platform each month.
- In the U.S., 54% of adults obtain news from social media platforms, with Facebook leading at 30%, followed by YouTube at 26%.
- Gen Z users spend an average of 4 hours per day on platforms like Instagram and Snapchat.
- 70% of all users check their social media feeds within 10 minutes of waking up.
- Since Q4 2021, there’s been a 58% increase in the number of users using TikTok to message friends and family.
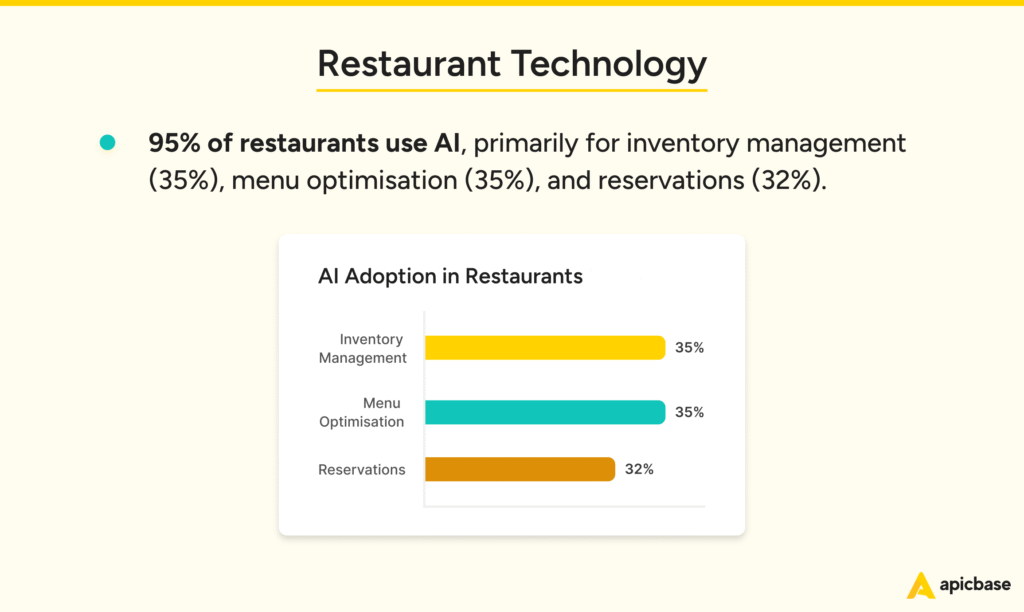
AI Usage in the Restaurant Industry
- 95% of restaurants now use AI technologies to enhance operations.
- 35% apply AI for inventory management, ensuring stock efficiency.
- Another 35% use AI for menu optimization, helping tailor offerings to customer preferences.
- 32% leverage AI to manage reservations, improving booking efficiency and customer service.
Cloud Computing and Storage Utilization
- By 2025, 50% of data will be stored in the cloud, up from 25% in 2015.
- The total global data is projected to reach 200 zettabytes by 2025.
- 33% of organizations are spending over $12 million annually on public cloud services in 2025, up from 29% in 2024.
- The global market for cloud-based AI services is projected to reach $97.9 billion by 2025.
- 83% of enterprise workloads are expected to be in the cloud by 2023, with AI workloads being a significant driver of cloud adoption.
- Amazon Web Services (AWS) offers over 175 AI services, including machine learning, natural language processing, and computer vision.
- 89% of companies use multiple clouds, while only 2% use a single private cloud solution.
AI and Automation Adoption Across Industries
- In 2025, 78% of firms are using AI, with budgets surging 92%, and the market racing to $1.8 trillion by 2030.
- AI adoption is growing by up to 20% each year, with generative AI usage jumping from 55% to 75% between 2023 and 2024.
- 80% of retail executives expect their businesses to adopt AI automation by the end of 2025.
- Over the next three years, 92% of companies plan to increase their AI investments.
- AI is applied in fields like healthcare, finance, retail, manufacturing, and cybersecurity, improving efficiency, productivity, decision-making, innovation, and customer experience.
- AI agents are evolving from basic co-pilots to autonomous “autopilot” systems capable of executing complex functions with minimal human input.
- China is aggressively advancing its AI-powered humanoid robot industry to transform manufacturing, with over $20 billion in government subsidies.
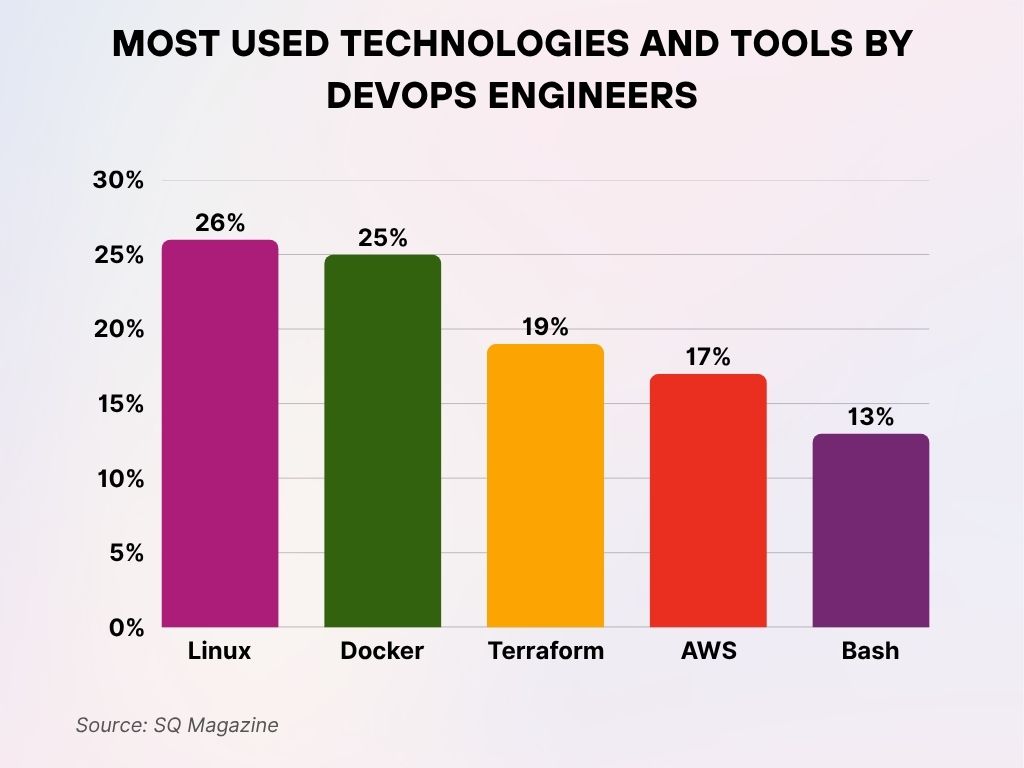
Most Used Technologies and Tools by DevOps Engineers
- Linux is the most widely used technology among DevOps engineers, with a 26% usage rate.
- Docker follows closely behind at 25%, indicating strong adoption of containerization tools.
- Terraform is used by 19% of DevOps professionals, reflecting the growing role of infrastructure as code.
- AWS accounts for 17% of tool usage, showcasing its relevance as a leading cloud service provider.
- Bash is still in active use by 13%, highlighting its continued importance in scripting and automation tasks.
Remote Work and Collaboration Technology Trends
- Approximately 28% of employees worldwide worked remotely in 2023, up from 20% in 2020.
- In the United States, about 22.8% of employees worked remotely at least part-time as of August 2024, translating to approximately 35.1 million people.
- 29% of U.S. workdays are still performed from home as of April 2025.
- Remote-only workers log 51 more productive minutes per day compared to hybrid or office-based peers.
- Organizations that have invested in advanced remote work technologies report a 50% boost in employee engagement.
- The global collaboration software market revenue hit $8.39 billion in 2025, up from $7.42 billion in 2024.
- Research indicates that 30% of employees expect remote work to remain permanent as companies adapt to new workforce preferences.
Cybersecurity Tool Usage Among Consumers and Businesses
- Worldwide cybercrime costs are estimated to hit $10.5 trillion annually by 2025.
- In 2024, the global average cost of a data breach was $4.88 million, a 10% increase from 2023.
- 55% of people in the U.S. would be less likely to continue doing business with companies that are breached.
- 51% of small businesses said their website was down for 8 to 24 hours following a cyberattack.
- 50% of small businesses with 50 or fewer employees rely on free or consumer-grade cybersecurity tools, which may not provide adequate protection.
- 65% of SMBs see cybersecurity as the number one business function that could be managed more effectively with AI.
- Hackers can penetrate at least 93% of company networks, highlighting the need for robust cybersecurity measures.
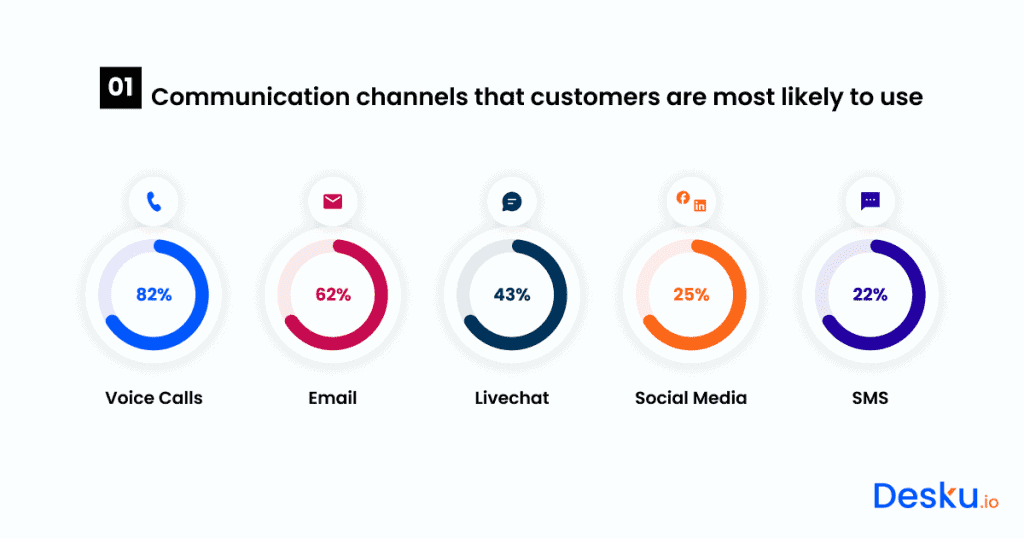
Preferred Customer Communication Channels
- Voice calls are the top communication choice, preferred by 82% of customers.
- Email is the second most popular channel, used by 62% of customers.
- Live chat is favored by 43%, highlighting demand for instant support.
- Social media is a contact method for 25% of customers.
- SMS is the least used, with 22% of customers opting for it.
Smart Home and IoT Device Adoption Rates
- The global smart home market is valued at $149.43 billion in 2025.
- 45% of U.S. households with internet access have at least one smart home device.
- 18% of U.S. households have six or more smart home devices.
- The global IoT market is projected to reach $1.06 trillion by 2025.
- The number of connected IoT devices is expected to be over 18 billion by 2025.
- 57% of all U.S. households are anticipated to have smart home devices by the end of 2025.
Digital Payment and Fintech Technology Usage
- 92% of U.S. consumers have used a digital payment in the past year.
- The digital payments segment leads the fintech market by user base, with over 3 billion users in 2024 and a projection of 4.45 billion by 2029.
- Fintech industry revenues are expected to grow nearly three times faster than those of traditional banks between 2022 and 2028.
- In 2025, fintech companies have a major opportunity to meet the growing demand for real-time, seamless B2B payment solutions.
- The evolution of payments includes real-time payments, stablecoins, and embedded finance, shaping how money moves globally.
- New payment types are rapidly becoming the norm, with P2P bank payments projected to reach nearly 184 million U.S. mobile phone users by 2026.
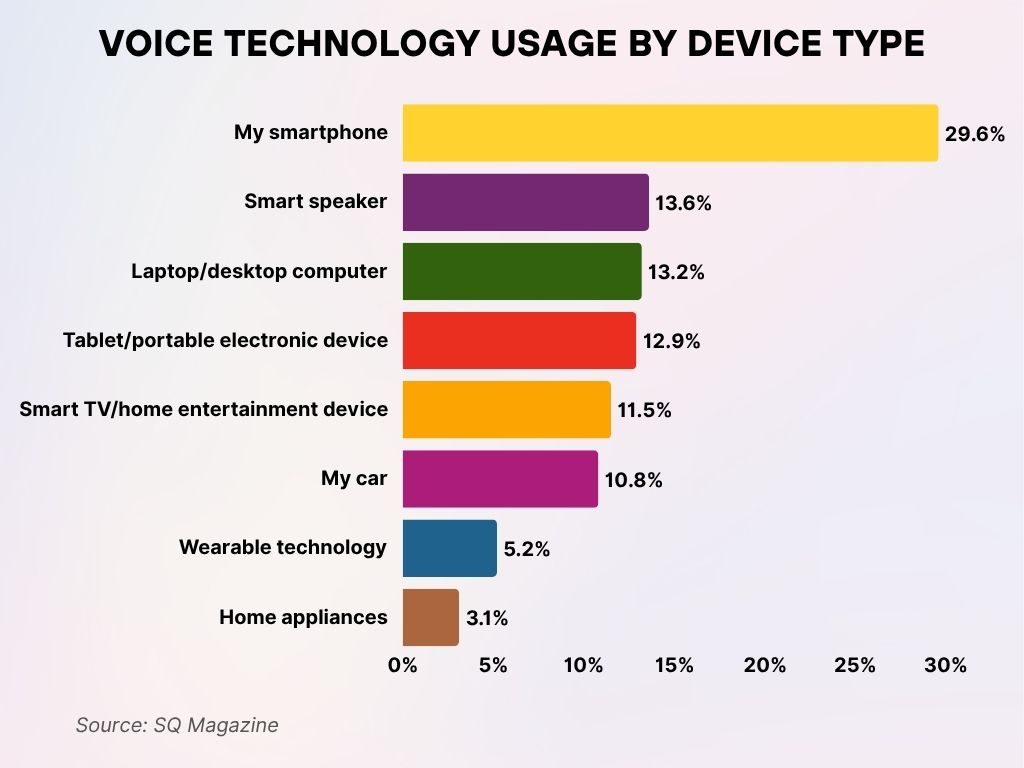
Voice Technology Usage by Device Type
- Smartphones lead in voice tech usage, accounting for 29.6% of total device interactions.
- Smart speakers follow with 13.6%, showing strong adoption in homes.
- Laptop or desktop computers make up 13.2% of voice tech use.
- Tablets and portable electronics are close behind at 12.9%.
- Smart TVs and home entertainment systems represent 11.5% of usage.
- Cars equipped with voice assistants account for 10.8%.
- Wearable tech, like smartwatches, is used 5.2% of the time.
- Home appliances make up the smallest share, with 3.1% usage.
Regional Differences in Technology Utilization
- China’s tech and durables sector is forecasted to grow by 5% in 2025.
- Emerging Asia (excluding China) is expected to see a 4% growth in tech and durables in 2025.
- Developed Asia and Latin America are expected to decline in tech and durables sales value in 2025 compared to 2024.
- Finland, Sweden, Norway, Denmark, and Estonia are developing a system for offline card payments to ensure continuity in case of internet disruptions.
- In Sweden, only 10% of people use cash, highlighting the need for resilient digital payment systems.
- The European Central Bank is anticipated to introduce a digital euro, reflecting growing concern over hybrid threats and the vulnerability of digital financial networks.
Environmental Impact of Technology Usage
- Globally, digital equipment is responsible for 4% of greenhouse gas emissions, with projections suggesting this could double by 2025.
- The manufacturing process of digital technology accounts for 47% of the sector’s emissions.
- Data centers, workplace devices, and ICT networks account for 6% to 12% of global energy use.
- Generative AI models like ChatGPT consume significant energy and water, with a single query using nearly ten times the energy of a typical Google search.
- Data centers already use 2% of global electricity, with figures as high as one-fifth in countries like Ireland.
- The extensive amounts of electricity and water necessary to develop, train, and sustain generative AI technology have serious environmental sustainability implications.
Recent Developments in Technology Usage
- Generative AI is set to dominate as a key technology trend in 2025, reshaping industries through its ability to create highly sophisticated and human-like content.
- The Gartner Top Strategic Technology Trends for 2025 include AI engineering, cybersecurity mesh, and hyperautomation.
- In 2025, AI and climate change, two major societal disruptors, will collide significantly, highlighting AI’s substantial environmental impact.
- The technology industry appears poised for growth in 2025, aided by increased IT spending, AI investments, and a renewed focus on innovation.
- AI is transforming business and driving autonomy, with trends defining the future of technology in 2025.
- The future of payments includes real-time, stablecoins, and embedded finance, with fintechs needing to watch these trends in 2025.
Conclusion
The year 2025 marks a significant milestone in technology usage, with widespread adoption across various demographics and regions. Smart home devices and IoT are becoming commonplace, digital payments are overtaking traditional methods, and AI continues to reshape industries. However, these advancements come with environmental considerations, emphasizing the need for sustainable practices. As technology continues to evolve, staying informed and adaptable will be crucial for individuals and organizations alike.


