At 8:12 AM in New York, a lifestyle influencer hits “Go Live” on Instagram. Within seconds, viewers from Tokyo, São Paulo, and London tune in. Real-time hearts flood the screen, questions pour into the chat, and brand sponsors silently smile at the unseen engagement spike. This is Instagram today, a platform where live data doesn’t sleep, and trends evolve by the hour.
As platforms chase instant interaction, Instagram’s live environment now serves as a digital heartbeat for real-time consumer behavior. Whether you’re a content strategist, brand manager, or curious scroller, these numbers offer the pulse of what’s working right now.
Editor’s Choice
- 3 billion monthly active users on Instagram by early 2026, up from 2 billion in 2025.
- Reels drive 50% of all time spent on the app, surpassing other content formats.
- Instagram Live broadcasts continue to experience rapid growth with increasing popularity in 2026.
- The average time spent per user reaches 34 minutes daily.
- Influencer posts with shopping products achieve 54% user purchase rate after viewing.
- Over 700 million users engage with Stories every day.
- Global CPM for Instagram ads averages $9.68, up 11% YoY.
Recent Developments
- Instagram Reels now support up to 20 minutes in length, rolled out globally.
- Reposting feature upgraded with dedicated “Reposted” tab on profiles for easier navigation.
- Instagram Edits app launched as a standalone video editor with AI effects and green screen.
- Stories gain AI generative tools for backgrounds and photo restyling via prompts.
- Carousels expanded to 20 slides per post for richer storytelling.
- Friends Map added to DMs for sharing locations with Close Friends.
- “Your Algorithm” feature allows customizing Reels feed preferences.
- Profile grid updated to rectangular 3:4 format for vertical content.
- Native iPad app released with optimized side-by-side messaging and comments.
- Comments are enabled on Stories, visible publicly for 24 hours.
Instagram Live Promotions Impact
- Businesses using Instagram Live for promotions report a 52% increase in customer interaction.
- Live video promotions drive stronger real-time engagement compared to static Instagram posts.
- Brands leveraging interactive Live features, such as comments and reactions, see higher audience participation.
- Instagram Live sessions encourage immediate feedback, boosting two-way communication between brands and viewers.
Popular Hashtags and Their Live Reach
- #love dominates with over 2.1 billion total uses, generating massive weekly impressions.
- #reels ranks second with 985 million posts, driving high viral reach.
- #ootd reaches 451 million posts, popular among fashion enthusiasts weekly.
- #tbt trends with 589 million uses, peaking at 750 million impressions on Thursdays.
- Posts with 9-11 hashtags boost reach by 79.5% on average.
- Niche hashtags under 10K uses yield 35% higher audience conversions for brands.
- At least one hashtag increases engagement by 12.6%, up to 79.5% with optimal use.
- 60% of users discover new accounts via hashtags, sustaining their impact.
Instagram Stories and Reels Live Performance Stats
- Reels account for 35% of total Instagram screen time.
- Reels are played over 140 billion times daily across platforms.
- 62% of Reel views come from non-followers via algorithm exposure.
- Reels deliver 29% greater ROI for brands using short-form video.
- Average Reel engagement rate stands at 1.23%.
- Reels reach 726.8 million users monthly for advertising.
- Short Reels under 15 seconds achieve 78% completion rate.
- Story open rates average 86%, higher for verified accounts.
- 41% higher CTR for Reels compared to image or carousel ads.
Top 10 Most-Followed Instagram Accounts
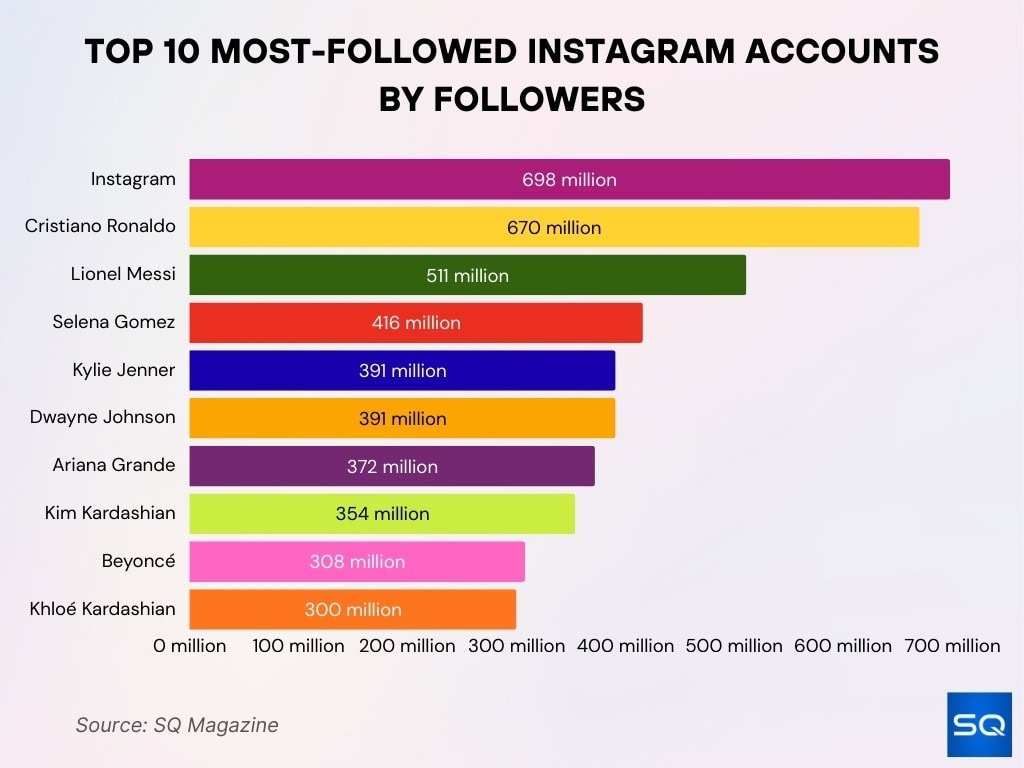
- Instagram is the most-followed account with 698 million followers, dominating the platform.
- Cristiano Ronaldo leads individuals with 670 million followers, reflecting unmatched global star power.
- Leo Messi follows with 511 million followers, remaining the second most-followed athlete.
- Selena Gomez leads female celebrities with 416 million followers, underscoring her strong fanbase.
- Kylie Jenner and Dwayne Johnson each have 391 million followers, closely contending in the top ranks.
- Ariana Grande commands around 372 million followers, sustaining her massive pop audience.
- Kim Kardashian reaches 354 million followers, reinforcing the Kardashian brand influence.
- Beyoncé holds about 308 million followers, maintaining her iconic cultural presence.
- Khloé Kardashian rounds out the top 10 with 300 million followers.
Real-Time Engagement Rates by Post Type
- Reels achieve the highest engagement at 1.23%, outperforming image posts at 0.70% and carousels at 0.99%.
- Carousels generate 12% more interactions than Reels and 2.14x more than single-image posts.
- Live videos maintain strong viewer retention with average watch times exceeding 14 minutes per session.
- Posts between 9 AM and 11 AM local time see 23% higher engagement than other slots.
- Carousels with over 3 slides boost interaction rates by 32% compared to single images.
- Music in Reels increases engagement by up to 27% per Meta benchmarks.
- Verified accounts receive 2.1x more engagement than non-verified profiles.
- Evening posts from 6 PM to 11 PM deliver the strongest engagement across weekdays.
Live Insights on Instagram Shopping and Commerce
- Instagram Shopping reaches 200 million monthly users globally.
- Overall checkout conversion rate averages 2.7%.
- Cart abandonment rates dropped to 18% for Instagram checkout.
- Average order value stands at $65 per transaction.
- In-app checkout usage grows 37% YoY among Gen Z.
- 44% of Millennials purchased via Instagram in the past 30 days.
- Fashion and beauty categories drive 65% of product views.
- Product tags receive 130 million monthly taps platform-wide.
- 57% of consumers trust verified creator Live showcases.
Instagram Live vs Other Live Streaming Platforms
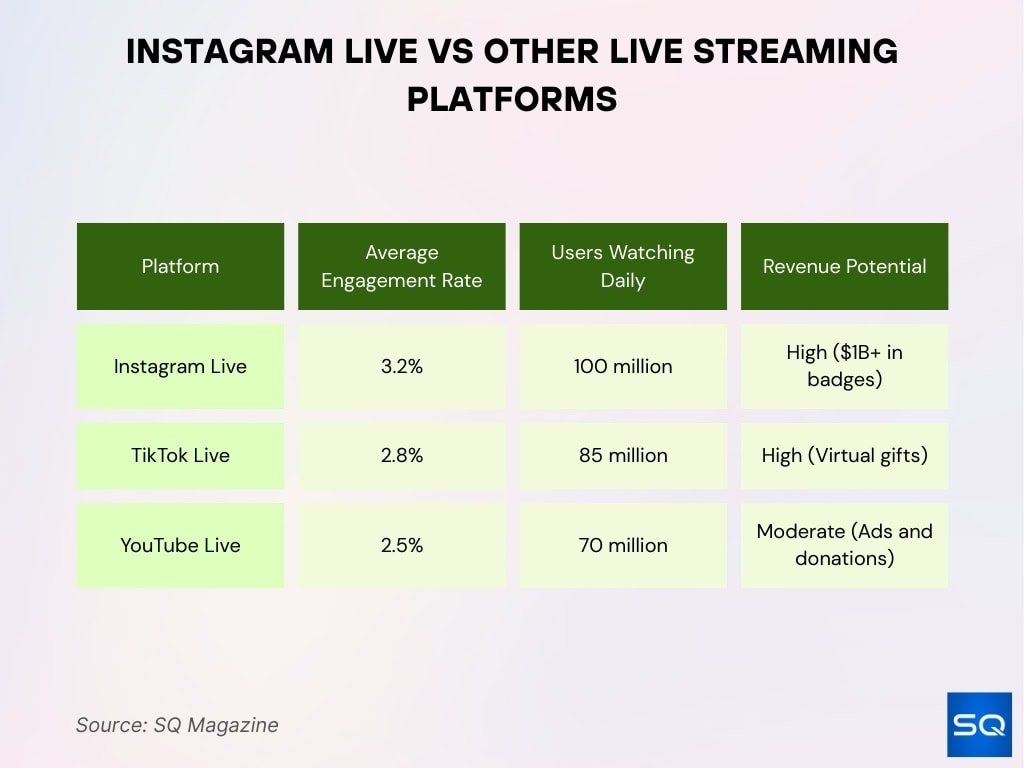
- Instagram Live records the highest average engagement rate at 3.2%, outperforming major competitors.
- Around 100 million users watch Instagram Live daily, making it the most-viewed social media live platform.
- TikTok Live follows with a 2.8% engagement rate and approximately 85 million daily viewers.
- YouTube Live reaches about 70 million daily users, with a 2.5% engagement rate.
- Instagram Live monetization is classified as high, generating over $1 billion through badges.
- TikTok Live also shows high revenue potential, driven primarily by virtual gifts.
- YouTube Live revenue remains moderate, relying on ads and viewer donations.
- Overall, Instagram Live leads in engagement, audience size, and revenue potential, positioning it as the strongest platform for live promotional content.
Real-Time Statistics on Influencer Engagement
- Nano influencers (1K–10K followers) average 2.19% engagement rate, the highest tier.
- Micro influencers (10K–50K followers) achieve 0.99% average engagement.
- Macro influencers (100K–500K followers) report 0.86% consistent engagement rate.
- Mega influencers (500K+) maintain 1.93% average engagement.
- Sponsored posts with Stories generate 22% more engagement.
- Nano influencers drive 7% conversion rate versus 3% for macro.
- Consistent Live sessions boost creator growth by 47%.
- 68% of marketers prioritize saves and shares over likes for success.
- Partnerships with discount codes yield 5.4x average ROI.
Live Data on Instagram Ad Reach and CPM
- Global average CPM for Instagram ads stands at $15.26, US at $23.
- Instagram ads reach 1.32 billion potential users monthly worldwide.
- Projected ad revenue surpasses $95 billion globally.
- Carousel ads deliver 20-30% higher CTR than single-image formats.
- Story ads CPM costs 17% less than Reels ads.
- The fashion sector captures 32% of total ad impressions.
- Influencer/UGC ads boost engagement 28% over stock creatives.
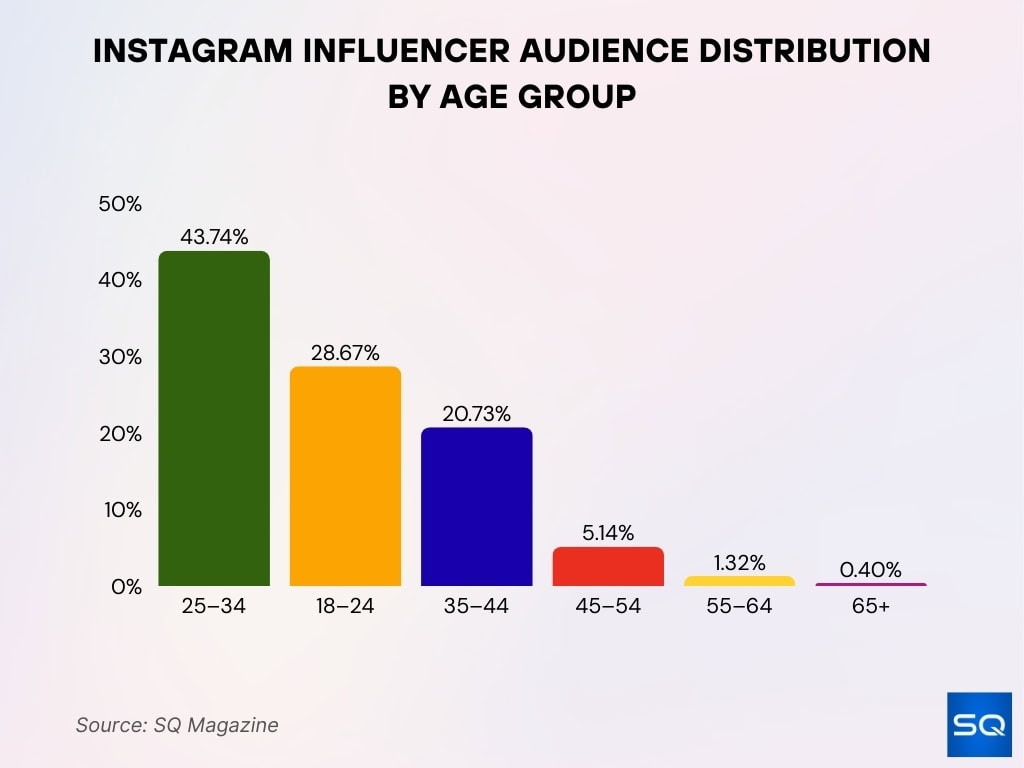
Instagram Influencer Audience by Age Group
- 25-34 year-olds comprise 43.74% of influencer audiences, the largest segment.
- 18-24 year-olds account for 28.67%, showing strong Gen Z engagement.
- 35-44 year-olds make up 20.73% of audiences.
- 45-54 year-olds hold 5.14% share, with steady older engagement.
- 55-64 year-olds represent 1.32% of influencer audiences.
- 65+ group constitutes 0.40%, the smallest demographic slice.
Top Countries by Instagram Users
- India tops the list with 413 million users, dominating global reach.
- United States ranks second with 173 million active users.
- Brazil secures third place with 141 million users.
- Indonesia follows with 103 million users, fueled by young demographics.
- Turkey holds fifth with 58 million users.
- Japan contributes 58 million users despite regional trends.
- Mexico adds 49 million users to the platform.
- United Kingdom has 35 million active users.
- Germany leads Europe with 34 million users.
- Italy rounds out the top 10 with 29 million users.
Live Metrics on Instagram Live Video Usage
- Over 100 million users watch or interact with Instagram Live daily.
- Live streams generate 10x more engagement than regular posts.
- Average Live session lasts 20 minutes.
- 57% of viewers watch at least 75% of streams.
- 80% of users prefer Live videos over blog posts.
- 63% more likely to purchase after Live demos.
- 52% boost in customer interaction for brands using Live.
- 55% of Gen Z engage with Live weekly.
- Live receives 6x more interactions than traditional videos.
Instagram Follower Count Correlation with Instagram Live
- Weekly Live users grow followers 27% faster than non-Live creators.
- Viewer-to-follower conversion during Lives averages 10-15%.
- Live engagement yields 10x more interactions, boosting visibility.
- 15-30% of Live viewers visit profiles post-session.
- Accounts under 50K followers gain 36% higher growth from Live.
- Interactive Lives with polls increases follow likelihood 2.9x.
- 70% viewer completion rate correlates with sustained growth.
- Live product demos drive 32% more link clicks and follows.
- Consistent Lives accelerate growth 3.7x via comments.
Tracking Growth Through Instagram Live Analytics
- Accounts optimizing Lives via analytics grow 43% faster.
- Engagement drops after 17 minutes, favoring shorter sessions.
- CTAs in the first 60 seconds yield 21% more engagement.
- AI recommendations boost Live visibility by 17%.
- Live replay highlights on Stories drive 31% post-event engagement.
- Brands improve targeting accuracy 24% using Live analytics.
- Live metrics track average view duration, peak viewers, and comment rates.
- Weekly Live analytics users see 3.7x more comments.
Engagement Rate Comparisons
- Overall, Instagram engagement averages 0.48%, with Reels at 2.7%.
- Carousels outperform Reels by 12% in interactions and 2.14x over images.
- Static images average 0.70% engagement rate.
- Nano influencers lead at 3.52% average engagement.
- UGC boosts saves 2.1x over branded visuals.
- Subtitled videos gain 28% more engagement.
- Influencer collaborations lift rates 19% higher.
- Behind-the-scenes content exceeds promotional by 38%.
How to Track My Growth on Instagram
- Instagram Insights tracks 1.5 billion daily reach, impressions, profile visits, and follower growth.
- Enable Professional Account for 95% analytics accuracy across Stories, Reels, Lives, and Posts.
- Buffer analyzes 20% monthly follower growth, engagement, top posts, and demographics.
- Iconosquare monitors over 100 metrics, including 30% reach increase.
- Sprout Social offers 99.9% uptime, real-time metrics, and custom reports.
- SocialBlade tracks 5-10% weekly follower growth publicly for free.
- Metricool visualizes 15% audience growth, demographics, and content performance.
- Later enables 25% hashtag performance insights across platforms.
- Hootsuite benchmarks 1.2% average engagement against industries.
- Agorapulse links to Google Analytics for 4x ROI tracking accuracy.
Real-Time Instagram Growth Trends by Industry
- Beauty and cosmetics average 4.0% engagement rate, leading industries.
- Nonprofits achieve 4.4% Instagram engagement, the highest benchmark.
- Construction and manufacturing hit 4.4% engagement rate.
- Financial services post 3.8% average Instagram engagement.
- Healthcare and biotech reach 3.7% engagement average.
- Media and entertainment lead with 3.0% engagement.
- Consumer goods and retail average 3.0% engagement rate.
- Technology influencers gain 17% higher engagement with Reels.
- Dining and tourism show 3.1% Instagram engagement.
- Fitness creators report 21% YoY follower growth.
Frequently Asked Questions (FAQs)
Instagram’s advertising reach is approximately 1.91 billion people as of late 2025.
29% of Instagram users reported making purchases on Instagram.
The platform had 2 billion monthly active users worldwide in 2025.
Conclusion
Instagram’s evolution into a real-time, engagement-centric platform is no longer a forecast; it’s our present. With billions of users tapping, scrolling, and reacting every day, the app’s live features, from Reels to Lives to Shopping, are shaping global culture and commerce alike.
Brands, creators, and consumers alike are adapting to faster trends, deeper analytics, and smarter tools. Whether you’re tracking your first 1,000 followers or strategizing a cross-continent campaign, one thing is certain: staying current means staying live.


