It’s a crisp fall morning in Portland. A local barista opens her shop and pulls out her phone to check delivery routes for fresh beans. She taps the familiar red-and-white pin icon, Google Maps. Across the globe in Tokyo, a student uses Street View to navigate to his university. Meanwhile, a food truck in Austin pings an update on Google Business to redirect lunchtime traffic. These small, daily decisions are powered by one of the most widely used platforms in the world.
Google Maps has grown from a simple navigation tool into a global infrastructure that connects people, businesses, and cities in real time. In this data-driven guide, we’ll explore the key statistics that define Google Maps in 2025, offering a clear picture of its scale, usage patterns, and impact.
Editor’s Choice
- Google Maps surpassed 2.2 billion active users worldwide in early 2025, continuing its dominant lead among location services.
- The daily active user base grew by 5.8% year-over-year, driven by increased adoption in developing regions.
- Over 71% of smartphone users in the US say they rely on Google Maps weekly for navigation and local searches.
- More than 40 million businesses are currently listed on Google Maps, with nearly 1.2 million new listings added monthly.
- Real-time traffic data coverage now extends to 99% of urban areas in North America and 85% of global metro regions.
- Google Maps accounted for 67% of global market share in mobile navigation apps as of Q1 2025.
- The platform’s AI-powered Live View usage rose by 38% from last year, thanks to wider AR integration and visual search tools.
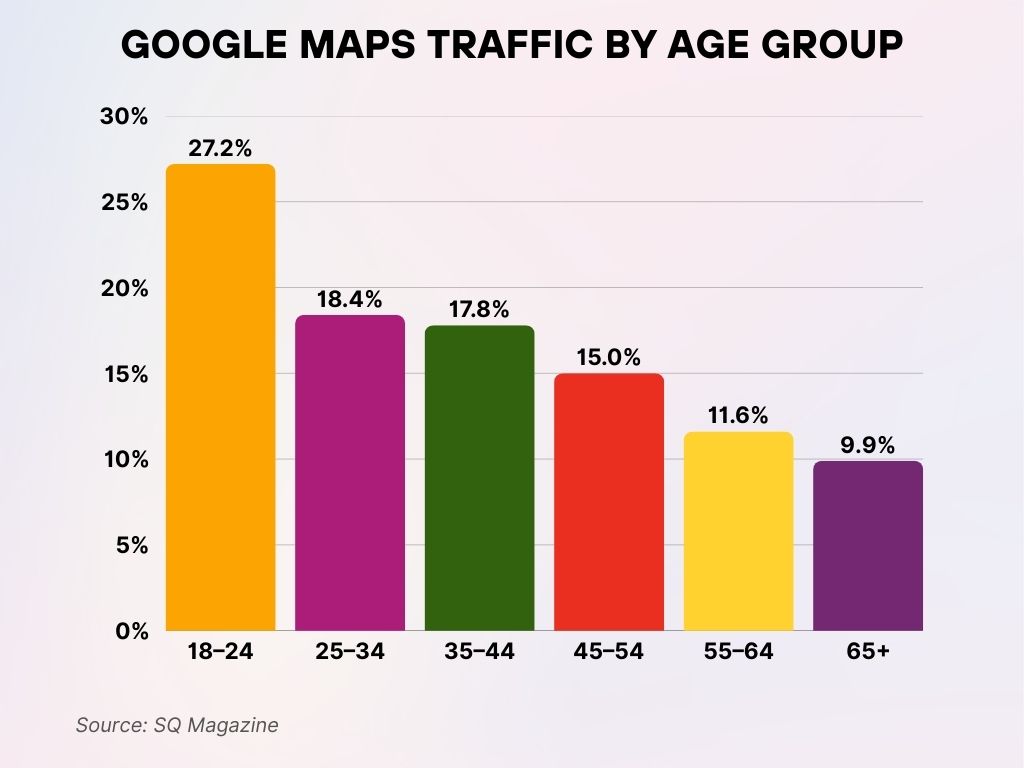
Google Maps Traffic by Age Group
- Users aged 18–24 make up the largest share of Google Maps traffic at 27.2%, highlighting high usage among Gen Z.
- The 25–34 age group contributes 18.4% of total traffic, reflecting strong engagement from younger millennials.
- Close behind, 35–44 year olds account for 17.8%, showing consistent usage into early middle age.
- The 45–54 demographic represents 15.0%, indicating a moderate drop in activity with older users.
- Users aged 55–64 contribute 11.6% of traffic, showcasing a lower but still notable presence.
- The 65+ age group makes up the smallest segment at 9.9%, suggesting limited adoption among senior users.
Total Number of Google Maps Users Worldwide
- As of Q1 2025, Google Maps has over 2.2 billion monthly active users, marking a 7.3% increase from 2024.
- The platform is used by over 70% of all Android users globally, making it the most ubiquitous location-based app.
- In the United States, roughly 85% of smartphone owners have Google Maps installed.
- Google Maps is now available in over 220 countries and territories, with 95 languages supported as of this year.
- The app sees over 5 billion unique location queries per day, including routes, business searches, and satellite views.
- In India alone, Google Maps crossed 480 million users, driven by urban expansion and affordable data plans.
- Over 300 million users access Google Maps through integrated third-party platforms like Uber, Airbnb, and food delivery services.
Daily Active Users and Engagement Metrics
- Google Maps attracts over 154 million daily active users globally, a 5.1% rise from 2024.
- In the US, users spend an average of 23 minutes per day on the app for commuting, planning, and reviews.
- 32% of users interact with local business listings while navigating through Maps, signaling strong local commerce engagement.
- Google Maps processes over 20 million real-time traffic reports daily, including incidents and speed data.
- During peak commuting hours (7–9 a.m. and 4–6 p.m.), usage spikes by up to 240% in metro regions like New York and Los Angeles.
- Voice navigation now accounts for 52% of driving mode usage, with increasing reliance on hands-free interaction.
- Google Maps’ “Explore Nearby” feature has seen a 46% surge in interactions since being upgraded with contextual recommendations.
- The average session time per user increased by 9% in 2025 due to enhancements in map rendering speed and predictive route suggestions.
- Over 68% of users allow background location tracking, enabling real-time data optimization for personalized navigation.
- Google Maps’ average load time has improved by 1.2 seconds, enhancing retention and bounce rates on mobile.
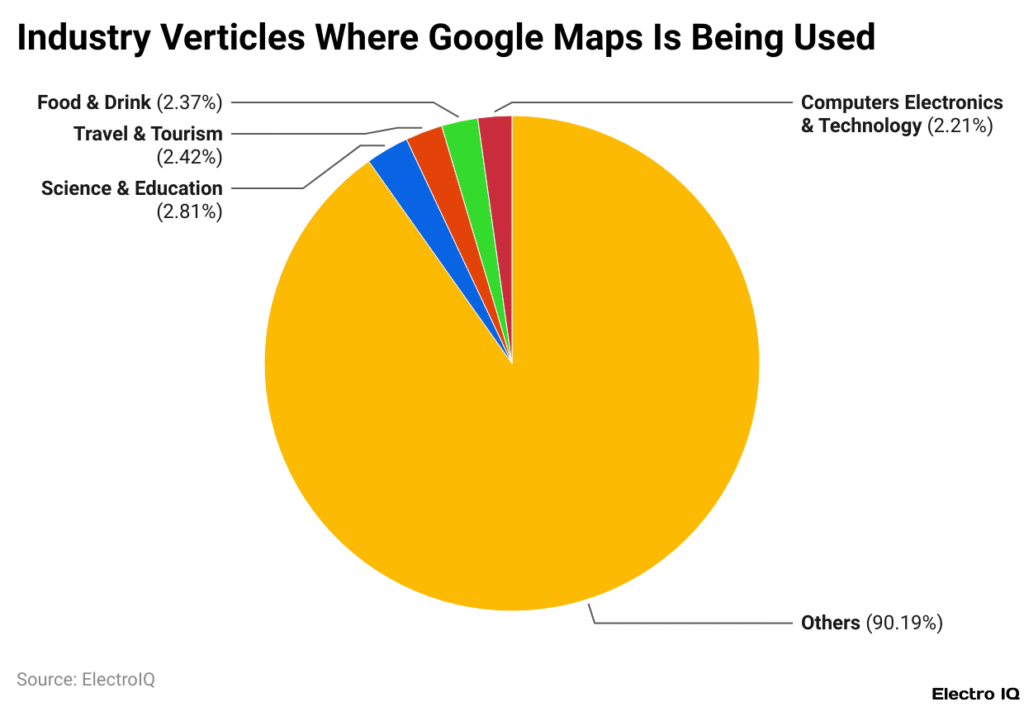
Industries Using Google Maps the Most
- Others make up the overwhelming majority of Google Maps usage, with 90.19%, covering a wide range of miscellaneous industries.
- Science & Education accounts for 2.81% of industry-related usage, showing a notable presence in academic and research sectors.
- Travel & Tourism represents 2.42%, highlighting its reliance on maps for navigation and customer engagement.
- Food & Drink contributes 2.37%, suggesting steady usage among restaurants and cafes for location services.
- Computers, Electronics & Technology holds 2.21%, indicating modest application in tech-related services and support.
Most Popular Features Used on Google Maps
- Turn-by-turn navigation remains the top-used feature, utilized by 76% of all users globally weekly.
- The Search Nearby tool is accessed by over 1 billion users monthly, commonly for food, fuel, and ATM locations.
- Street View usage grew by 14% year-over-year, with immersive previews now integrated into hotel and property listings.
- The Saved Places feature has over 350 million users, with “Favorites” and “Want to Go” lists gaining traction among travelers.
- Google’s “Timeline” feature is now used by 1 in 5 users to track location history for commuting, fitness, and tax logs.
- Offline maps were downloaded 450 million times in the last 12 months, driven by international travel and data-saving needs.
- Live View for AR walking navigation is now active in over 100 cities, with 3D overlays guiding users through urban landmarks.
- The multi-stop trip planner feature is used in 41% of long-distance route queries, especially by delivery and logistics professionals.
- Google Maps’ ride-hailing integrations (like Uber and Lyft) were used for 60 million trip bookings in Q4 2024 alone.
- Indoor maps (airports, malls, stadiums) are now supported in more than 12,000 buildings worldwide.
Google Maps Usage by Country and Region
- United States leads in active user base, with over 270 million monthly users relying on Google Maps for daily navigation and local business discovery.
- India follows closely with 480 million active users, up from 440 million in 2024, fueled by expanding mobile internet access.
- In Brazil, over 78% of smartphone users use Google Maps regularly, especially for public transportation and delivery services.
- Japan saw a 19% year-over-year increase in AR-based navigation usage in Google Maps, particularly among tourists.
- In Europe, Germany, France, and the UK combined account for more than 120 million monthly active users.
- Canada ranks among the top five countries for per capita engagement, with 42% of users accessing Maps at least once per day.
- Indonesia surpassed 85 million users in 2025, a 12% increase, aligning with its growing gig economy and ride-hailing services.
- In Nigeria, Google Maps adoption rose by 23%, making it the most-used navigation app in Sub-Saharan Africa.
- Australia has seen a steady increase in usage, with 18.4 million monthly users, or nearly 70% of the total population.
- Mexico has over 65 million users, with the Explore and Business Listing features being the most popular.
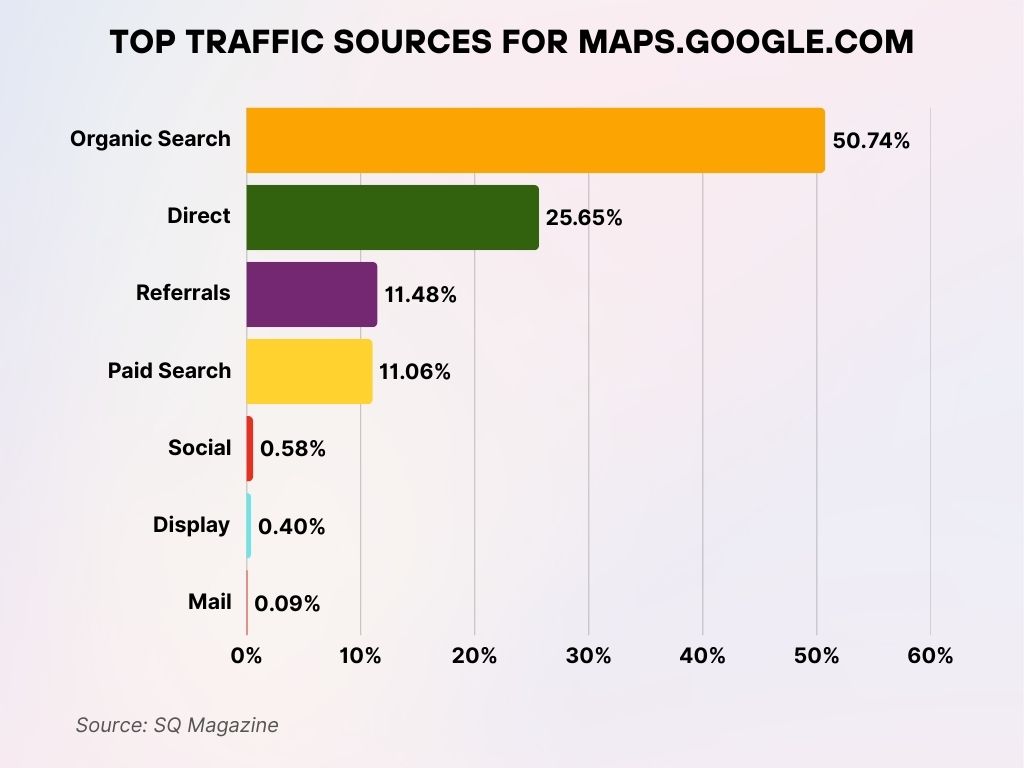
Top Traffic Sources for maps.google.com
- Organic Search drives the majority of traffic at 50.74%, showing the platform’s strong visibility on search engines.
- Direct traffic accounts for 25.65%, indicating a high number of users access Google Maps by typing the URL or using bookmarks.
- Referrals contribute 11.48%, suggesting third-party websites play a modest role in redirecting users.
- Paid Search brings in 11.06% of traffic, highlighting investment in sponsored listings.
- Social traffic is minimal at 0.58%, showing limited engagement through platforms like Facebook or Twitter.
- Display ads represent just 0.40%, indicating low reliance on banner-based promotion.
- Email (Mail) accounts for only 0.09%, showing that email campaigns barely contribute to traffic.
Google Maps in Navigation vs. Local Discovery
- 72% of users use Google Maps primarily for navigation, while 28% rely on it for discovering local businesses, events, and services.
- In the US, Google Maps drives 1.5 billion monthly local discovery searches, such as finding restaurants, gas stations, and ATMs.
- Walking and cycling directions usage increased by 21% in 2025, with a surge in eco-conscious commuting.
- Delivery drivers report Google Maps as their preferred tool, with over 68% citing route accuracy and real-time updates as top reasons.
- The Explore tab saw a 34% rise in engagement, especially after updates featuring curated neighborhood guides.
- Local Guides contributions now influence more than 38% of discovery decisions, indicating trust in peer recommendations.
- Driving mode remains dominant in suburban and rural areas, while transit and walking modes are preferred in cities.
- Google Maps processed over 320 million restaurant-related searches in the first quarter of 2025 alone.
- The average user interacts with 3.2 business listings per session during discovery use cases.
- Search personalization based on browsing history and reviews improved engagement by 26% year-over-year.
Business Listings and Google Maps Integration
- There are now over 40 million verified business profiles on Google Maps, a 12% increase compared to 2024.
- More than 1.2 million businesses are added each month, with the majority coming from developing regions and small enterprises.
- 82% of local businesses in the US maintain an active Google Business profile integrated with Maps.
- Businesses with optimized listings receive 70% more location requests and 42% more direction taps than unoptimized listings.
- Photos and menus uploaded by businesses increase customer interaction rates by up to 55%.
- Reviews influence over 85% of Google Maps-driven consumer decisions, particularly in the hospitality and retail sectors.
- Small businesses with 4-star ratings or higher see an average 32% increase in foot traffic within six months.
- In 2025, 35% of businesses now use Google Posts to promote events, updates, or offers directly in Maps.
- Over 15 million businesses globally are leveraging the Google Maps API for embedded maps and route planning on their websites.
- Google Maps listings are now integrated with Google Pay and Reserve with Google, allowing in-app booking and payments at over 200,000 locations.
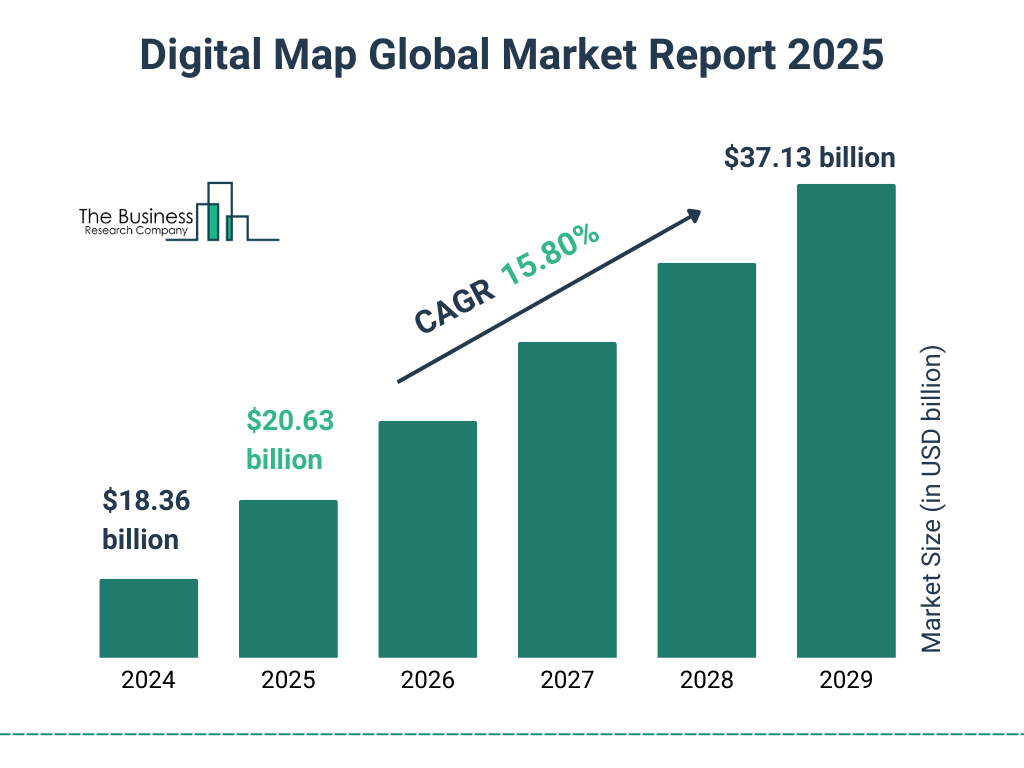
Digital Map Market Forecast (2024–2029)
- The global digital map market is expected to grow from $18.36 billion in 2024 to $37.13 billion by 2029.
- In 2025, the market size is projected to reach $20.63 billion, indicating steady year-over-year growth.
- The market is forecasted to expand at a CAGR of 15.80%, reflecting rapid adoption across industries.
- By 2027, the digital map market will be significantly larger, with continuous growth projected through 2028 and 2029.
Mobile App vs. Desktop Usage Statistics
- Mobile usage dominates, with 92% of all Google Maps interactions occurring on smartphones or tablets in 2025.
- Desktop access is most common for planning longer trips, accounting for 8% of total usage, particularly among users aged 45 and above.
- The Android app leads with over 1.6 billion downloads, compared to 450 million downloads on iOS.
- Tablet usage for Google Maps rose by 13%, largely driven by integration in in-vehicle infotainment systems.
- Google Maps is the second most-used app on Android phones in the US after YouTube.
- 85% of mobile users enable location access, enabling real-time navigation, traffic alerts, and personalized recommendations.
- Desktop users spend longer per session, averaging 8.3 minutes, compared to 4.5 minutes on mobile.
- The Maps app now features dark mode, which 74% of users have enabled, contributing to longer battery life and improved night-time visibility.
- Mobile app users are 3.2x more likely to leave reviews compared to desktop users.
- Offline map downloads on mobile increased by 27%, especially among travelers and logistics companies.
Google Maps and Real-Time Traffic Data Usage
- Google Maps processes over 20 billion traffic data points per day, including congestion, road closures, and speed traps.
- Real-time traffic predictions are now 94% accurate, thanks to AI-driven models and community reporting.
- The average commute time in major US cities dropped by 4.6%, attributed in part to optimized route suggestions from Google Maps.
- Waze integration continues to enhance Google Maps’ traffic accuracy, combining user reports with sensor data.
- Transit delay notifications in real time are now available in 98 countries, covering 2,500+ transit systems.
- Peak hour congestion alerts were viewed over 800 million times in Q1 2025 alone.
- 40% of Google Maps users receive alternate route suggestions based on live traffic updates during navigation.
- Google Maps now provides parking availability forecasts in over 60 cities, based on historical and current data.
- Road hazard reports have increased by 17%, a result of growing community contributions via the “Report” button.
- Google Maps has integrated incident heat maps in urban areas, helping city planners identify traffic bottlenecks and high-risk zones.
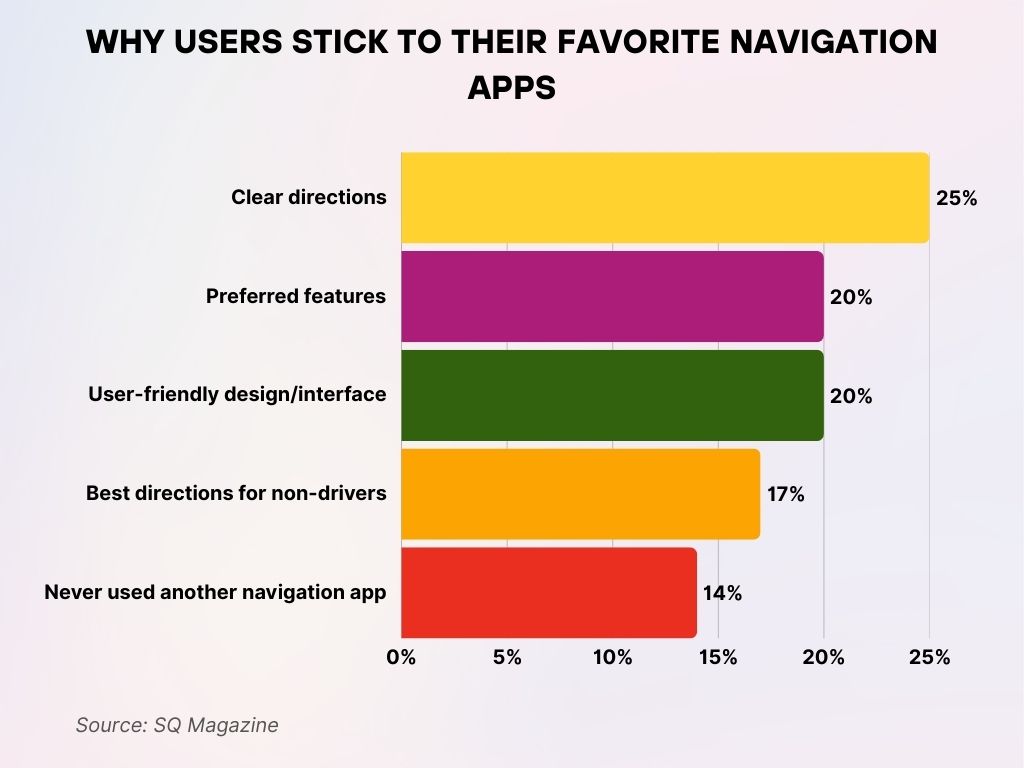
Why Users Stick to Their Favorite Navigation Apps
- 25% of users say they use their favorite navigation app because it offers clear directions, making route guidance the top priority.
- 20% prefer apps with specific features that match their needs, showing the importance of customization and functionality.
- Another 20% value a user-friendly interface, indicating that simplicity and ease of use are critical to retention.
- 17% choose their app for providing the best directions for non-drivers, reflecting the growing demand from pedestrians, cyclists, and transit users.
- 14% of users have never tried another app, suggesting strong brand loyalty or satisfaction with their first choice.
Google Maps Contributions: Reviews, Photos, and Edits
- In 2025, over 1.4 billion reviews will be hosted on Google Maps, with nearly 12 million new reviews posted every week.
- User-submitted photos on Google Maps surpassed 42 billion, offering rich visual context for local listings.
- Local Guides contributed 87% of all edits made to business information, helping maintain real-time accuracy.
- There are over 150 million Local Guides globally, with 7 million classified as Level 6 or above based on contributions.
- Google has processed more than 2.8 billion suggested edits to business details since the start of 2024.
- Photos tagged with “Menu” or “Interior” generate 4x higher engagement than those without labels.
- Review ratings average 4.3 stars globally, with hospitality and food sectors receiving the most frequent feedback.
- In the US, businesses with more than 100 reviews see a 65% higher click-through rate from Maps.
- Crowdsourced corrections (e.g., wrong opening hours, closures) are typically reviewed and updated within 48 hours.
- Google Maps now uses AI to detect fake or incentivized reviews, blocking more than 25 million spam reviews in 2024 alone.
AR and AI Features Adoption on Google Maps
- Live View AR navigation is now available in over 100 major cities, with adoption rates growing 38% YoY.
- Google’s Immersive View, combining AR and AI, now covers thousands of global landmarks and urban centers.
- AI-driven route planning now personalizes suggestions based on travel history, time of day, and traffic behavior.
- AR walking directions usage increased by 22%, particularly among users aged 18–34 in dense city zones.
- The newly launched “Neighborhood Vibe” AI feature uses aggregated user reviews and photos to give context before arrival.
- Lens in Maps, which overlays real-world visuals with search insights, is now used by over 18 million users monthly.
- Google Maps AI voice guidance has improved accessibility, now supporting 38 languages with natural intonation.
- Predictive location suggestions now account for 15% of user interactions, helping reduce input friction.
- AI-detected map anomalies, like missing roads or unmarked trails, are flagged with 82% accuracy.
- The upcoming AR “follow me” feature for indoor navigation is in beta testing in airports and malls across 10 countries.
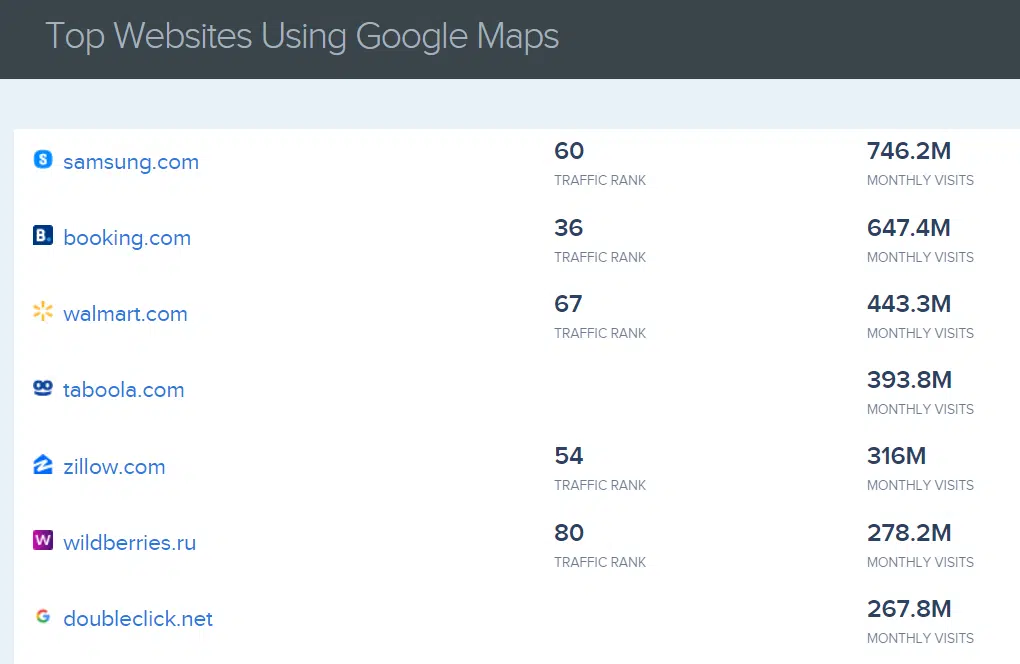
Top Websites Leveraging Google Maps Integration
- samsung.com leads with 746.2M monthly visits and a traffic rank of 60, showing strong user engagement alongside map features.
- booking.com follows with 647.4M visits and a traffic rank of 36, benefiting from Maps in the travel booking experience.
- walmart.com sees 443.3M visits, ranking 67, using Maps likely to boost store location visibility.
- taboola.com attracts 393.8M monthly users with a traffic rank of 54, integrating Maps into content recommendations.
- zillow.com reports 316M visits, using Maps heavily in real estate navigation and listings.
- wildberries.ru pulls in 278.2M visits and has a traffic rank of 80, indicating adoption of Maps for logistics and retail.
- doubleclick.net records 267.8M visits, leveraging Maps for ad placement and location-based analytics.
Google Maps and Environmental Impact Insights
- Google Maps now integrates eco-friendly routing, prioritizing low-emission and fuel-efficient paths by default.
- In 2025, eco-routes have saved users an estimated 1.2 million metric tons of CO₂ emissions globally.
- Electric vehicle (EV) route planning has grown by 56%, with real-time charging station availability.
- Google’s “Green Directions” tool is available in over 45 countries, helping users minimize environmental impact.
- In select cities, Google Maps partners with local governments to share anonymized mobility data for climate planning.
- The “bike route preference” tool now includes elevation tracking and pollution level data.
- Over 2.1 million users have opted into eco-driving insights, which track acceleration, idling, and braking patterns.
- Walking and transit over driving has been promoted more aggressively, with in-app nudges contributing to a 3.5% shift in user behavior.
- Google Maps’ environmental impact calculator now supports real-time estimates of CO₂ per trip.
- A new pilot feature, Tree Canopy Explorer, helps urban users choose shaded walking routes based on AI mapping.
Market Share Compared to Other Mapping Services
- As of Q1 2025, Google Maps holds 67% global market share, dominating navigation and local search platforms.
- In the US, Google Maps is used by 8 in 10 smartphone users, far ahead of competitors like Apple Maps (18%) and Waze (12%).
- Waze, also owned by Google, maintains a stronghold in driver communities but saw flat growth in 2025.
- Apple Maps usage increased slightly, rising by 2.3% year-over-year, largely among iOS-exclusive users.
- HERE Technologies holds 6.5% global share, driven by automotive integrations in Europe and enterprise logistics.
- Bing Maps and MapQuest have under 2% market penetration, mostly used in legacy or embedded systems.
- OpenStreetMap contributions grew by 14%, but it remains a developer-focused platform with limited consumer reach.
- Google Maps dominates voice-based navigation, integrated with Google Assistant, smartwatches, and smart displays.
- Among Android users, Google Maps comes pre-installed on 98% of devices, reinforcing its default status.
- In developing markets, Google Maps’ availability in local dialects and offline support gives it a strategic advantage over competitors.
Monetization and Advertising Statistics
- Google Maps generated an estimated $8.7 billion in ad revenue in 2024, a 16% increase YoY.
- Sponsored pins and promoted listings are used by over 2.5 million businesses, especially in retail and hospitality.
- Businesses using Google Maps ads see a 20–30% increase in in-store visits, depending on category.
- Google’s “Local Campaigns” have expanded globally, offering hyper-targeted ads based on map interactions.
- Cost-per-click (CPC) on Google Maps ads averages $1.38, slightly lower than traditional search ads.
- Restaurant and café advertisers saw a 40% boost in click-through rates when using geo-targeted offers.
- Maps Ads now support integration with Google Shopping, allowing users to browse product availability by store.
- Push notifications for deals nearby are enabled by 43% of users, improving ad performance in proximity-based campaigns.
- Automotive and tourism sectors are the top ad spenders on Maps, especially during seasonal peaks.
- In 2025, Google introduced “Pay to Pin”, a feature allowing small businesses to sponsor their visibility during busy hours.
Recent Developments in Google Maps
- Google Maps’ Indoor Live View has expanded to airports and stadiums in 12 new countries in 2025.
- The platform launched Immersive View for Routes, offering a 3D fly-through of entire trips with traffic and weather overlays.
- EV route planner updates now suggest stops based on battery model, charging speed, and driver habits.
- Google has integrated wildfire and flood zone alerts into Maps for regions in the US, Australia, and parts of Southeast Asia.
- The Transit tab was revamped, featuring real-time seat availability and crowd prediction.
- Google Maps added AI-generated summaries of businesses, pulled from reviews and photo metadata.
- New Lens-powered restaurant previews help users scan menus and see top-rated dishes via AR.
- The app now supports offline public transit maps in over 75 major cities, improving functionality without mobile data.
- Google has begun testing “Neighborhood Highlights”, an AI-curated feed of local events, openings, and tips.
- A collaborative planning feature, Maps Groups, allows multiple users to add stops and vote on shared itineraries.
Conclusion
From real-time traffic reroutes to augmented reality walking paths, Google Maps in 2025 is more than just a digital map, it’s a dynamic infrastructure that powers global mobility and local discovery. Whether you’re a commuter in Chicago, a traveler in Bangkok, or a business owner in Houston, the platform shapes how people move, explore, and interact with the world around them.
Its combination of user-driven content, machine learning, and environmental insight makes Google Maps a critical tool for urban planning, commerce, and everyday convenience. As new technologies like AR and eco-routing continue to evolve, Google Maps is well-positioned to redefine how we navigate both physical and digital spaces in the years ahead.


