WHAT WE HAVE ON THIS PAGE
- Editor’s Choice
- Global iPhone User Growth
- Global iPhone Sales Volume and Revenue Trends
- iPhone Market Share by Region
- Apple’s Quarterly Revenue Breakdown by Category
- iPhone User Demographics and Usage Patterns
- iOS vs Android Adoption Rates
- Gender Distribution of iPhone Users
- Most Popular iPhone Models in 2025
- Average Selling Price (ASP) of iPhones
- iPhone 16 vs iPhone 15 Preorder Lead Times
- iPhone Upgrade Cycle and Consumer Retention Rates
- App Store and iPhone App Usage Statistics
- Current iPhone Price Ranges (2025)
- Environmental Impact and iPhone Recycling Data
- iPhone 16e Global Market Distribution
- Recent Developments in iPhone Technology and Performance
- Conclusion
- Sources
It was just a few short years ago that smartphones shifted from luxury tech to everyday essentials, and no brand has been more central to this shift than Apple. Picture this: a commuter scrolling through news on an iPhone while sipping coffee, a teenager FaceTiming their friend after school, a professional checking calendar invites mid-meeting—all tied to a single device that has seamlessly woven itself into daily routines.
Now, in 2025, the iPhone remains more than a phone; it’s a cultural mainstay, an economic engine, and a barometer of consumer tech trends. In this article, we dive deep into the latest iPhone statistics for 2025, uncovering insights from sales to sustainability, and everything in between.
Editor’s Choice
- Apple sold approximately 237 million iPhones in the first three quarters of 2025, positioning it to possibly surpass its 2021 record of 240 million units by year-end.
- The global revenue generated by iPhone sales has reached $212.4 billion so far in 2025, reflecting strong performance driven by demand for premium models.
- The iPhone 15 Pro Max emerged as the best-selling model of Q1 and Q2 2025, accounting for 28.5% of all iPhone shipments.
- Apple’s share in the global smartphone market stands at 21.9% in 2025, a modest increase from 20.8% in 2024, driven largely by growth in Asia-Pacific and the Middle East.
- In the U.S., the iPhone maintains a commanding 57.3% market share in 2025, continuing its dominance over Android competitors.
- The average iPhone user now spends 5.6 hours per day on their device, up 9% from the previous year, driven by video content, social media, and AI-based tools.
- Apple’s trade-in and recycling program in 2025 recovered more than 13 million devices, up from 10.5 million in 2024, reflecting growing consumer interest in sustainability.
Global iPhone User Growth
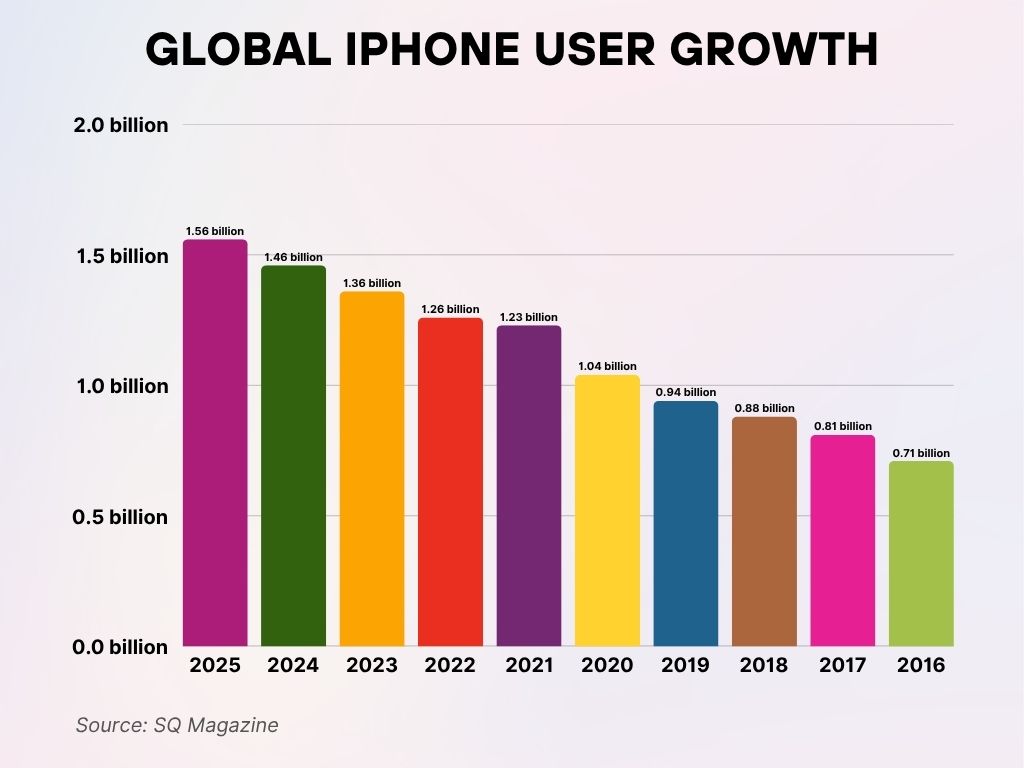
- In 2025, the number of iPhone users worldwide is projected to reach 1.56 billion.
- By 2024, there were approximately 1.46 billion iPhone users globally.
- In 2023, the global iPhone user base hit 1.36 billion.
- The year 2022 saw iPhone users increase to 1.26 billion.
- In 2021, iPhone users stood at around 1.23 billion worldwide.
- The user base grew to 1.04 billion in 2020, crossing the 1-billion mark.
- 2019 recorded about 0.94 billion iPhone users globally.
- In 2018, the number of users reached 0.88 billion.
- 2017 had 0.81 billion iPhone users worldwide.
- Back in 2016, the global iPhone user count was 0.71 billion.
These figures highlight the steady year-over-year growth in iPhone adoption worldwide, with over 2x growth between 2016 and 2025.
Global iPhone Sales Volume and Revenue Trends
- As of Q3 2025, Apple has shipped 237 million iPhones globally, representing a 3.1% year-over-year increase from the same period in 2024.
- Revenue from iPhone sales has hit $212.4 billion in the first nine months of 2025, tracking ahead of 2024’s total $204.8 billion.
- iPhone revenue from the U.S. alone accounts for 42% of total global sales, or approximately $89.2 billion so far in 2025.
- Apple saw an 11% increase in revenue from India in 2025, thanks to improved local production and strong uptake of the iPhone 14 and 15 series.
- Europe contributed $48.6 billion in iPhone revenue in 2025, up from $44.1 billion in 2024, with notable growth in Germany and France.
- The Asia-Pacific region (excluding China) recorded a 15% year-over-year growth in iPhone units sold in 2025, totaling 51 million devices.
- In China, Apple experienced a slight 1.4% decline in iPhone sales in 2025, attributed to intensified local competition.
- Latin America saw iPhone unit shipments grow by 18% in 2025, reaching 12.3 million units, led by Mexico and Brazil.
- The global average revenue per unit (ARPU) in 2025 stands at $897, up from $867 in 2024, driven by stronger sales of Pro models.
- Apple’s iPhone segment remains the largest contributor to its total revenue, accounting for over 52% of the company’s overall earnings in 2025.
- In the United States, Apple maintains a 57.3% market share in the smartphone market as of Q3 2025, up from 56.1% the year prior.
- In Canada, iPhone usage has climbed to 51.7%, marking a significant rise driven by student and enterprise adoption.
- Apple’s market share in Western Europe stands at 31.4% in 2025, bolstered by strong iPhone 15 sales in Germany and the UK.
- India reached a milestone with Apple capturing 8.2% market share in 2025, nearly doubling from 4.4% in 2023, thanks to local assembly and aggressive retail expansion.
- In Japan, iPhones command a staggering 66.1% market share, affirming Apple’s unique cultural foothold in the region.
- In Brazil, Apple’s market share has increased to 18.7%, up from 15.5% last year, despite high import tariffs.
- The Middle East and Africa region has seen steady iPhone growth, with Apple now holding 16.5% market share in 2025, up from 13.9% in 2024.
- In Australia, the iPhone’s share reached 54.9%, a jump driven by demand for advanced camera features in the 15 Pro series.
- In Southeast Asia, iPhone penetration is at 12.3%, with Singapore and Vietnam emerging as high-growth zones.
- In South Korea, Apple’s market share remains modest at 11.2%, facing intense competition from Samsung’s flagship Galaxy line.
Apple’s Quarterly Revenue Breakdown by Category
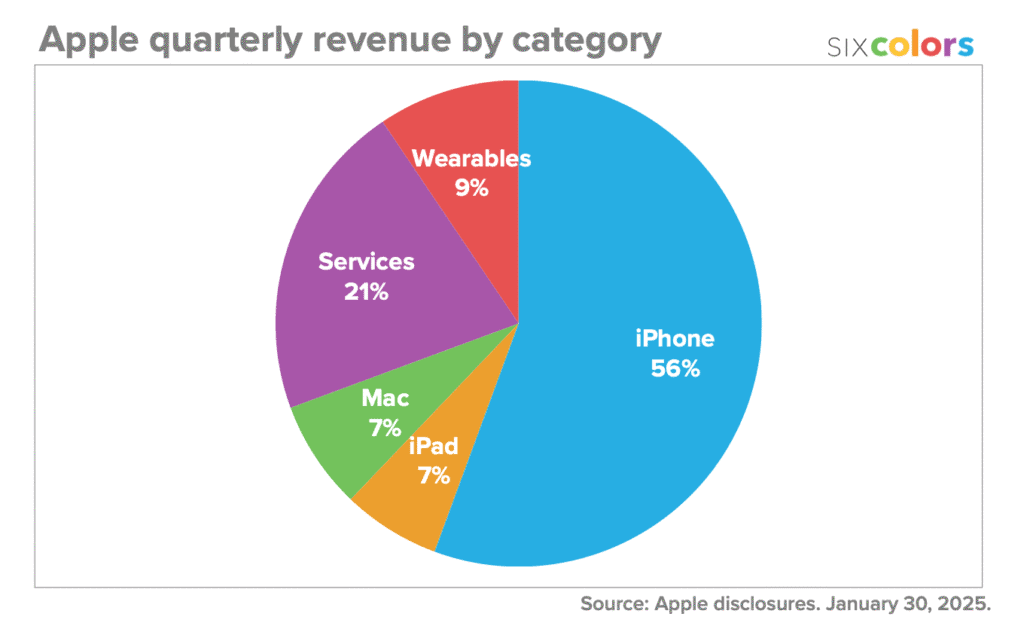
- iPhone dominates Apple’s revenue, contributing 56% of total quarterly earnings.
- Services come second, accounting for 21% of the revenue.
- Wearables represent 9% of quarterly revenue.
- Both Mac and iPad contribute equally, each generating 7% of the total.
These figures highlight Apple’s strong reliance on iPhone sales, while its Services and Wearables segments show growing importance in diversifying revenue streams.
iPhone User Demographics and Usage Patterns
- In 2025, there are an estimated 1.47 billion active iPhone users worldwide, with 294 million of them based in the United States alone.
- Millennials (ages 27–42) make up the largest iPhone user base in the U.S., accounting for 38% of total users in 2025.
- Among Gen Z users aged 18–26, 61% own an iPhone in the U.S., up from 56% in 2024, driven by social media and video-centric usage.
- On average, iPhone users interact with their device 89 times per day in 2025, a 12% increase from the previous year.
- The average screen time among iPhone users in 2025 is 5.6 hours per day, with social media apps accounting for 32% of that usage.
- iPhone users in the U.S. now spend an average of $154 annually on app purchases and subscriptions in 2025, a 7.8% increase from 2024.
- iPhone ownership among users earning over $100,000/year in the U.S. stands at 78%, compared to just 39% among those earning under $40,000/year.
- In 2025, 82% of U.S. teens reported that their primary phone is an iPhone, up from 76% in 2024, according to Piper Sandler’s annual teen survey.
- Globally, iPhone penetration in urban areas is 65.4%, while rural penetration remains lower at 28.9% in 2025.
iOS vs Android Adoption Rates
- As of Q2 2025, iOS holds 31.9% of the global smartphone OS market, a marginal rise from 30.6% in 2024.
- In the U.S., iOS dominates with a commanding 58.2% market share in 2025, compared to Android’s 41.5%.
- Japan continues to be the strongest iOS market globally, with iOS adoption reaching 66.1% in 2025, led by loyalty and localized features.
- In Western Europe, iOS holds 32.4% market share in 2025, driven by strong Pro model performance in Germany and France.
- In India, iOS adoption hit 8.2% in 2025, up from 6.1% in 2024, reflecting increasing affordability and local manufacturing incentives.
- Among U.S. smartphone switchers in 2025, 29% of Android users moved to iOS, while only 12% went the other way.
- Teen adoption of iOS reached 85% in the U.S. in 2025, an all-time high fueled by ecosystem lock-in and brand status.
- iOS users are 3.6x more likely to make in-app purchases than Android users in 2025, underscoring Apple’s monetization strength.
- In China, iOS holds 18.7% of the mobile OS market in 2025, showing resilience despite regulatory and competitive pressures.
- The global iOS active install base surpassed 1.5 billion devices in 2025, an all-time record for Apple.
Gender Distribution of iPhone Users
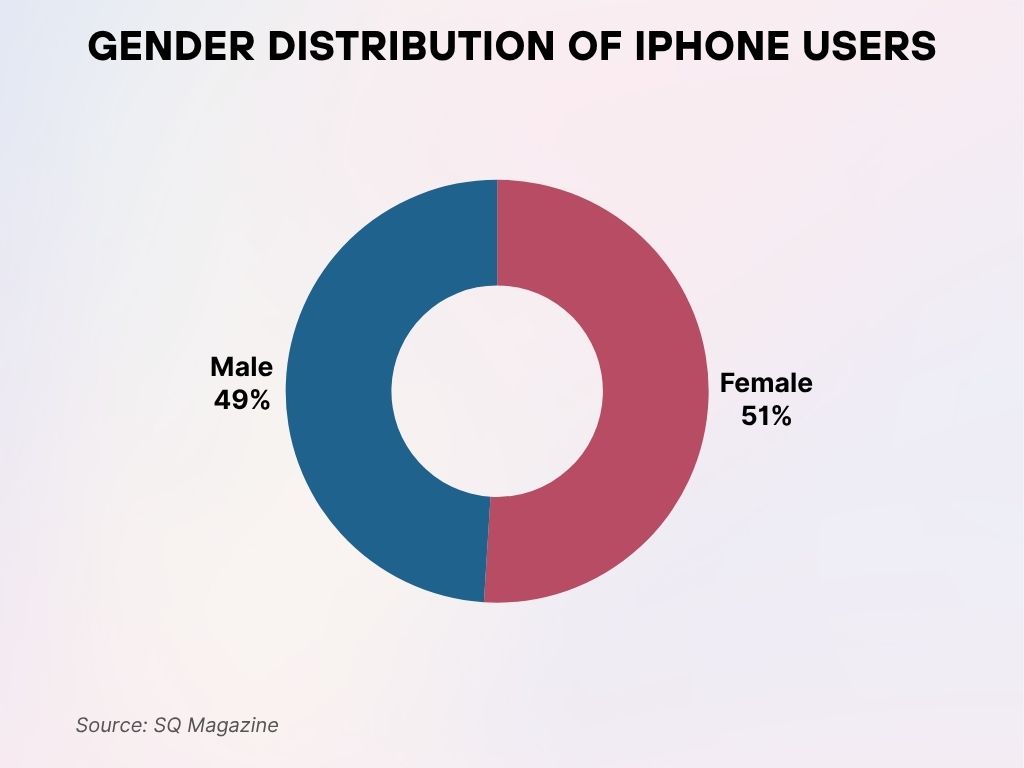
- Female users slightly outnumber male users, making up 51% of all iPhone users.
- Male users account for 49% of the iPhone user base.
The data shows a balanced gender split, indicating near-equal appeal of the iPhone across both genders.
Most Popular iPhone Models in 2025
- The iPhone 15 Pro Max is the top-selling iPhone in 2025, accounting for 28.5% of global iPhone sales.
- The iPhone 14 holds second place with 21.2% of total sales in 2025, especially popular in emerging markets due to price drops.
- Apple’s iPhone SE (3rd gen) saw a 12% YoY increase in sales in 2025, particularly in India and Eastern Europe.
- In the U.S., the iPhone 15 Pro has overtaken the 14 Pro as the go-to choice for professionals, with a 19% share of total iPhone sales.
- iPhone 13 continues to perform strongly in 2025, holding 10.7% of total unit sales, appealing to budget-conscious buyers.
- The new iPhone 15 Ultra, launched in early 2025, quickly captured 6.9% of Apple’s global smartphone sales thanks to an enhanced camera and a titanium frame.
- In Japan, the iPhone 14 Pro remains popular, with over 2.8 million units sold in the first half of 2025.
- iPhone 12 shipments are steadily declining, representing less than 2.3% of sales in 2025, down from 4.1% in 2024.
- The average user lifecycle of top-tier iPhone models like the 15 Pro Max is now 3.2 years, up from 2.8 years in 2024.
- The iPhone 15 Pro Max received the highest customer satisfaction score (94/100) among all models in 2025, driven by performance and battery life.
Average Selling Price (ASP) of iPhones
- The global ASP for iPhones reached $897 in 2025, up from $867 in 2024, due to higher sales of premium models.
- In North America, the ASP is even higher, standing at $1,031 in 2025, driven by the dominance of Pro and Ultra models.
- Europe saw an ASP of $924 in 2025, rising slightly from $902 last year, impacted by exchange rates and product mix.
- In India, Apple managed to lift ASP to $652 in 2025, marking a 9.4% increase over 2024, driven by local assembly of higher-end models.
- In China, ASP grew to $812 in 2025, up from $783 in 2024, amid strong sales of the iPhone 15 line.
- The iPhone 15 Ultra has the highest individual ASP at $1,299, with its sales accounting for 6.9% of total units.
- ASP for trade-in deals in the U.S. now averages $422, up 11% YoY, encouraging more frequent upgrades in 2025.
- Among corporate buyers, the ASP for iPhones in 2025 is $1,047, as businesses increasingly opt for Pro models.
- The ASP gap between iPhones and Android devices widened to $394 in 2025, reinforcing Apple’s premium positioning.
- iPhone accessories and upsells (like AppleCare and MagSafe products) add an average of $89 per sale to Apple’s revenue in 2025.
iPhone 16 vs iPhone 15 Preorder Lead Times
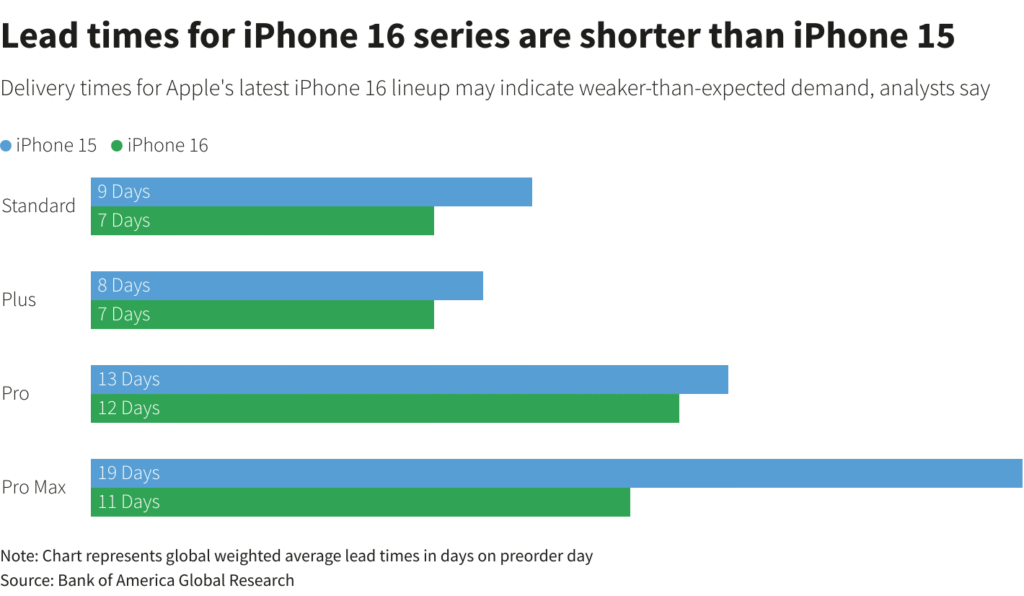
- iPhone 16 Standard has a lead time of 7 days, down from 9 days for the iPhone 15 Standard.
- iPhone 16 Plus shows a 7-day lead time, slightly shorter than the 8 days for the iPhone 15 Plus.
- iPhone 16 Pro lead time is 12 days, compared to 13 days for the iPhone 15 Pro.
- iPhone 16 Pro Max has the most significant drop, with a lead time of 11 days versus 19 days for the iPhone 15 Pro Max.
These shorter delivery times suggest weaker-than-expected demand for the iPhone 16 lineup compared to the iPhone 15 series, based on preorder day averages.
iPhone Upgrade Cycle and Consumer Retention Rates
- In 2025, the average iPhone upgrade cycle in the U.S. is 3.2 years, slightly up from 3.0 years in 2024, reflecting longer device lifespans.
- Apple’s iPhone retention rate remains industry-leading at 92% in the U.S., driven by ecosystem loyalty and high customer satisfaction.
- Among iPhone 13 users, 41% plan to upgrade in 2025, with most citing battery life and camera improvements as key motivators.
- 26% of iPhone owners in the U.S. participated in Apple’s Upgrade Program in 2025, up from 22% the previous year.
- 56% of iPhone 12 users are still actively using their devices in 2025, indicating high product longevity.
- In Japan, the average upgrade cycle is shorter, at 2.7 years, influenced by carrier incentives and cultural preferences.
- Apple’s trade-in volume increased to 13 million devices in 2025, up from 10.5 million in 2024, reducing the financial burden of upgrades.
- Among corporate users, the iPhone upgrade cycle is now 2.6 years, as businesses prioritize newer models for performance and security.
- Globally, 43% of users say they wait for major design changes before upgrading, which aligns with demand spikes for the iPhone 15 Ultra.
- In 2025, 74% of users who upgraded stayed within the same model tier (e.g., Pro to Pro), showing consistency in user preferences.
App Store and iPhone App Usage Statistics
- The App Store generated $79.6 billion in gross revenue in the first three quarters of 2025, on pace to surpass $100 billion by year-end.
- The average iPhone user downloads 38 apps per year in 2025, with the top categories being social media, finance, and health.
- TikTok, Instagram, and YouTube remain the top three most-used apps on iPhones in 2025, with a daily average usage of 91 minutes combined.
- In 2025, 65% of iPhone users in the U.S. subscribe to at least one paid app or service, led by iCloud+, Apple Music, and fitness apps.
- Apple Arcade now boasts 240 titles and has over 56 million subscribers as of mid-2025.
- The average in-app spend per iPhone user globally is $62.50 in 2025, up 8% YoY, driven by gaming and productivity apps.
- Health and fitness app installs rose 13% YoY in 2025, boosted by integration with the iPhone’s advanced health sensors.
- 60% of app store revenue in 2025 comes from games, led by titles like Genshin Impact, Roblox, and Clash of Clans.
- App Store search accounts for 58% of app discovery among iPhone users in 2025, emphasizing the need for strong ASO strategies.
- In-app purchases on iPhones now contribute 71% of total app revenue on the App Store in 2025, reflecting deep user engagement.
Current iPhone Price Ranges (2025)
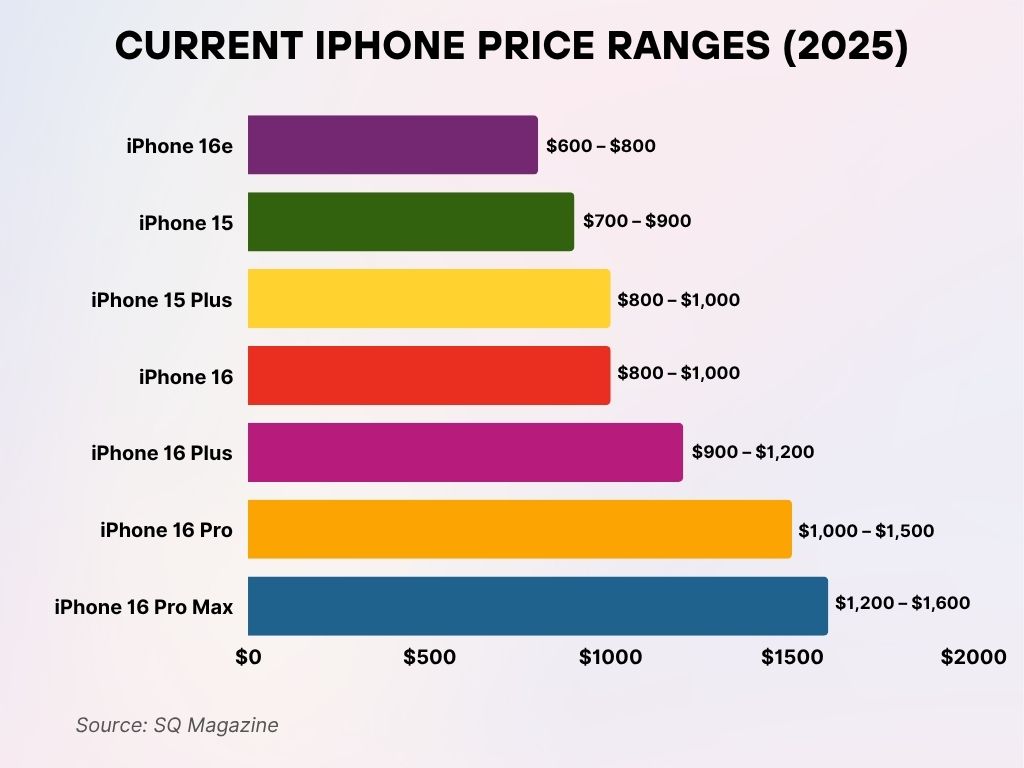
- iPhone 16e is the most affordable, priced between $600 – $800.
- iPhone 15 is slightly higher, ranging from $700 – $900.
- Both iPhone 15 Plus and iPhone 16 share a similar price range of $800 – $1,000.
- iPhone 16 Plus sits in the mid-premium tier at $900 – $1,200.
- iPhone 16 Pro caters to high-end users, priced between $1,000 – $1,500.
- iPhone 16 Pro Max is the most expensive, with a price range of $1,200 – $1,600.
These price tiers reflect Apple’s diversified product strategy, offering options across entry-level to premium segments.
Environmental Impact and iPhone Recycling Data
- Apple reports that 100% of new iPhone 15 and 15 Pro models in 2025 are made with recycled rare earth elements.
- The company has recycled over 13 million iPhones globally in 2025, an increase of 24% YoY.
- Apple’s Daisy robot disassembled approximately 2.5 million devices in 2025, reclaiming materials like lithium, cobalt, and gold.
- Each iPhone 15 Ultra uses over 75% recycled aluminum in its enclosure, the highest among all Apple products.
- The carbon footprint of iPhone production dropped by 12.8% in 2025, thanks to energy-efficient supply chains and transportation practices.
- In 2025, Apple’s carbon-neutral shipping initiative covered 42% of all iPhone deliveries globally.
- The company’s packaging for iPhones is now 100% plastic-free and 95% recyclable as of 2025.
- Over 19 million users participated in Apple’s environmental awareness programs in 2025, marking a record level of engagement.
- Apple aims to make every iPhone carbon neutral by 2030, and 2025 marked the halfway milestone toward that goal.
- In the U.S., 32% of iPhone buyers in 2025 said environmental impact influenced their model choice.
iPhone 16e Global Market Distribution
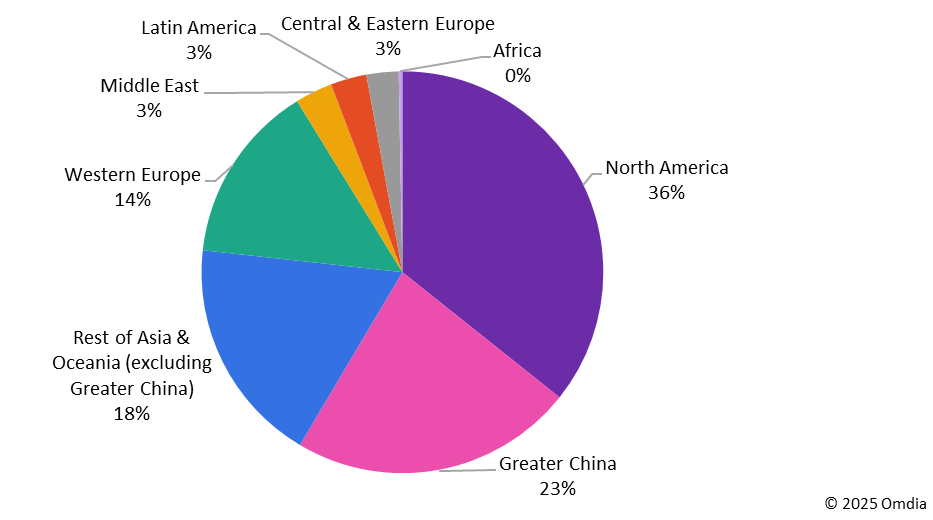
- North America leads in iPhone 16e adoption, accounting for 36% of the global share.
- Greater China follows with a significant 23% market share.
- Rest of Asia & Oceania (excluding Greater China) represents 18% of users.
- Western Europe contributes 14% to the iPhone 16e user base.
- Regions like the Middle East, Latin America, and Central & Eastern Europe each hold a 3% share.
- Africa shows a negligible presence with a 0% share.
These figures reflect a strong demand in developed markets, with North America and China being the primary drivers of Apple’s AI-powered iPhone 16e push.
Recent Developments in iPhone Technology and Performance
- The iPhone 15 Pro Max features Apple’s first 3nm A18 Pro chip, delivering 25% faster processing and 30% improved energy efficiency in 2025.
- The iPhone 15 Ultra introduced dual-layer OLED technology, enhancing brightness and color accuracy by 18%.
- Apple’s AI integration in iOS 18, released in 2025, brought on-device personal assistants, AI-generated summaries, and advanced camera scene recognition.
- iPhones in 2025 support Wi-Fi 7, offering 4.8x faster download speeds compared to Wi-Fi 6.
- The iPhone 15 Pro and Ultra now include thermal regulation systems, reducing overheating during gaming and heavy use.
- Apple added satellite messaging capabilities for emergencies to all iPhone 15 models in 2025, expanding beyond premium variants.
- Face ID on iPhone 15 now works in horizontal orientation, a long-requested feature standard across models.
- Battery life has improved by 17% on average across the iPhone 15 series, thanks to silicon-carbon battery enhancements.
- The iPhone 15 Ultra camera features a periscope lens with 6x optical zoom, setting a new benchmark in mobile photography in 2025.
- Apple’s Neural Engine can now perform up to 38 trillion operations per second, powering real-time AI translations and augmented reality apps.
Conclusion
The iPhone in 2025 is more than just a device, it’s a comprehensive ecosystem that blends innovation, utility, and sustainability. Whether it’s the shift toward recycled materials, the increasing dominance in high-value markets, or the seamless integration of AI, Apple’s trajectory continues to lead the smartphone industry with precision.
This year, we’ve seen growth in nearly every metric: sales volume, revenue, upgrade adoption, and software engagement. As Apple advances into new frontiers like spatial computing and AI-powered personalization, the iPhone remains the standard bearer for what a smartphone can and should be.
Sources
- https://backlinko.com/iphone-users
- https://www.statista.com/topics/870/iphone/
- https://www.businessofapps.com/data/apple-statistics/
- https://www.demandsage.com/iphone-user-statistics/
- https://www.answeriq.com/iphone-user-statistics/
- https://www.skillademia.com/blog/iphone-statistics/
- https://en.wikipedia.org/wiki/IPhone
- https://www.britannica.com/technology/iPhone

