WHAT WE HAVE ON THIS PAGE
- Editor’s Choice
- Most Popular Social Media Platforms
- Global Social Media Usage Overview
- User Demographics by Age and Gender
- Fastest-Growing Social Media Platforms (Worldwide)
- Country-Wise Social Media Penetration
- Reasons for Using Social Media
- Top Reasons Why People Use Social Media
- Social Media Behaviors by Country
- Average Time Spent on Social Media Platforms
- Brand Engagement by Social Media Platform
- Mobile vs Desktop Usage Patterns
- Social Media Advertising Revenue Statistics
- Social Media Advertising Reach & Spending in 2025
- Influencer Marketing Growth Trends
- Engagement Rates Across Platforms
- How Gen Z and Millennials Use Social Media to Discover Products
- Social Media and E-Commerce Integration
- Privacy and Data Sharing Statistics
- Social Media Trends Among Gen Z and Millennials
- Business Usage and B2B Social Media Statistics
- Recent Developments in Social Media Analytics
- Conclusion
- Sources
In 2004, a Harvard student launched a platform that would go on to redefine how humans connect. Fast forward to 2025, social media isn’t just a way to stay in touch—it’s where people shop, learn, protest, play, and even find love. From early-morning scrolls to late-night reels, platforms have woven themselves into the fabric of everyday life.
But how big is this digital web we’ve spun? Who’s using it, how often, and why? Let’s break down the latest 2025 social media statistics to understand how the world continues to shape—and be shaped by—these powerful platforms.
Editor’s Choice
- 5.17 billion people globally now use social media, representing 64.4% of the world’s population.
- The average daily time spent on social media in 2025 is 2 hours and 28 minutes per user.
- Facebook remains the most-used platform with 3.05 billion monthly active users.
- TikTok leads in engagement, with users spending an average of 55 minutes per day on the app.
- In the US, 72.3% of adults reported using social media daily in 2025.
- YouTube Shorts has surpassed 3.1 billion daily views, up 38% year-over-year.
- Gen Z users dominate Instagram and TikTok, while Facebook still holds strong with Millennials and Gen X.
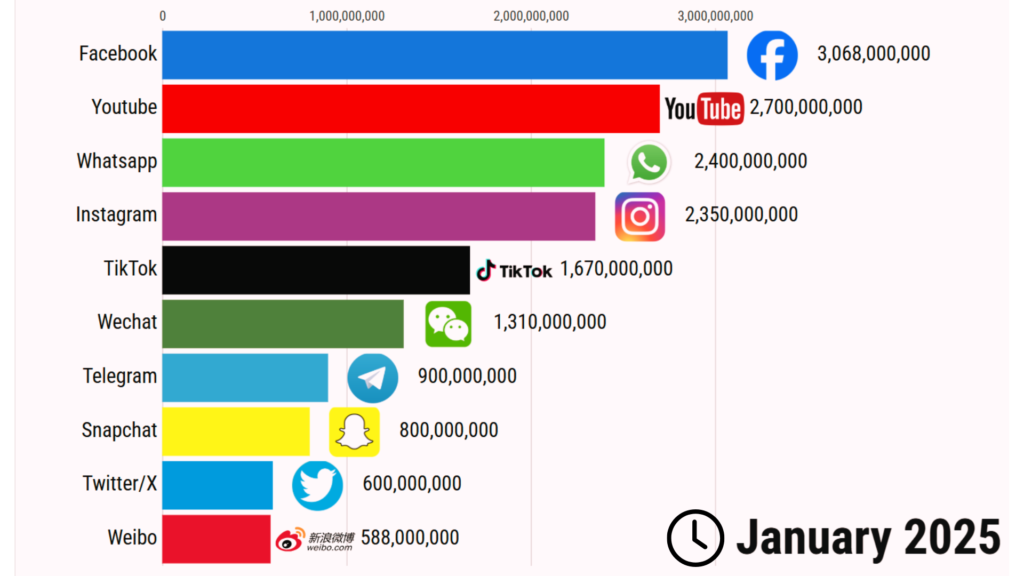
- Weibo, China’s microblogging platform, closes the list with 588 million users, sustaining its place in the Chinese digital sphere.
- Facebook remains the global leader with 3.07 billion monthly active users, showing its continued dominance in the social networking space.
- YouTube ranks second with 2.7 billion users, reflecting the massive global demand for video content consumption.
- WhatsApp has 2.4 billion monthly users, making it one of the most widely used messaging platforms in the world.
- Instagram is close behind with 2.35 billion users, driven by its visual content, Stories, and Reels features.
- TikTok has reached 1.67 billion users, continuing its rapid growth as a short-form video powerhouse.
- WeChat records 1.31 billion monthly active users, highlighting its critical role in China’s digital ecosystem.
- Telegram now serves 900 million users, benefiting from its focus on privacy and large-scale group messaging.
- Snapchat stands at 800 million users, maintaining strong appeal among younger demographics.
- Twitter/X has a user base of 600 million, remaining influential despite competition from newer platforms.
- As of Q1 2025, 5.17 billion people actively use social media, up from 4.89 billion in 2024.
- The number of social media users has grown at an annual rate of 5.7% globally.
- Asia leads in volume with over 2.6 billion users, followed by Europe at 757 million.
- The average person uses 6.8 social media platforms per month.
- 89.4% of internet users are active on social media.
- The global internet penetration rate stands at 68.6%, meaning a majority of the online population is also on social media.
- Emerging markets like Nigeria, Pakistan, and Vietnam show the highest YoY user growth, averaging 8% to 11% increases.
- Mobile-first regions dominate usage patterns, with 96.2% of users accessing platforms via smartphones.
- Over 83% of users say social media helps them “stay informed about current events.”
- AI-driven recommendations now influence nearly 40% of platform content exposure.
User Demographics by Age and Gender
- Gen Z (ages 12–27) accounts for 39% of TikTok’s global audience and 34% of Instagram’s.
- Millennials (ages 28–43) are the largest demographic on Facebook, at 32% of its user base.
- Women make up 55.3% of Pinterest users and 52.7% of Instagram users globally.
- Snapchat’s core audience remains 13–24-year-olds, making up 67% of its user base.
- On LinkedIn, 61% of users are male, and the largest age segment is 25–34.
- TikTok sees a gender split of 53% female and 47% male, with high engagement among under-18 users.
- In the US, 88% of adults aged 18–29 use at least one social media platform daily.
- Facebook sees the highest retention among 35–54-year-olds, especially in North America and Europe.
- WhatsApp usage spans all age groups, but adoption among 55+ users has grown 22% since 2023.
- The fastest-growing group on Instagram is users aged 45–54, rising by 11.6% YoY.
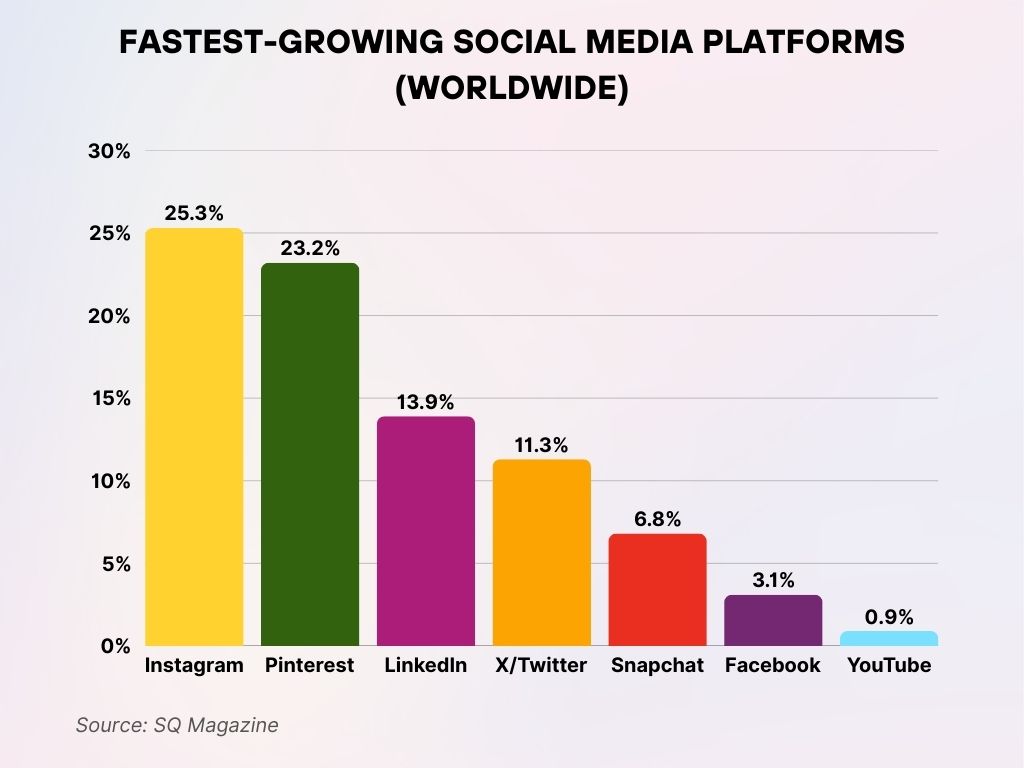
- YouTube had the lowest growth at just 0.9%, possibly due to market saturation and stronger competition in short-form video.
- Instagram leads the pack with a 25.3% growth rate, making it the fastest-growing social media platform globally in the latest rankings.
- Pinterest follows closely, expanding at a rate of 23.2%, showing strong traction especially in visual discovery and inspiration.
- LinkedIn saw a 13.9% growth rate, highlighting its increasing role in professional networking and B2B engagement.
- X/Twitter experienced 11.3% growth, driven by ongoing platform changes and user engagement in real-time conversations.
- Snapchat grew by 6.8%, continuing to appeal to younger demographics through AR filters and short video content.
- Facebook posted a modest 3.1% growth, reflecting its shift toward mature markets and diversified platform offerings.
- The United Arab Emirates leads with a 99.1% social media penetration rate.
- South Korea follows closely at 94.8%, showcasing its tech-savvy, hyper-connected society.
- The United States stands at 82.6%, with nearly 276 million active social media users.
- Brazil has a penetration rate of 77.5%, with over 169 million users in 2025.
- India, despite being mobile-first, has a lower penetration rate at 48.6%, but accounts for over 720 million users.
- Nigeria is emerging quickly, now at 45% penetration, up from 39% in 2023.
- In Japan, social media usage is at 76%, with Twitter/X and LINE being dominant platforms.
- Mexico shows a rate of 79.3%, driven by mobile access and youth usage.
- Indonesia, one of the fastest-growing markets, has a penetration of 68.7% with 187 million users.
- Germany and France both exceed 85% penetration, though Facebook and Instagram lead over TikTok in these regions.
- In 2025, 68% of users globally say they use social media to stay updated on news and current events.
- 57% use platforms to stay in touch with friends and family, making it the second most cited reason.
- 44% of global users follow brands to discover new products and services.
- Entertainment and memes motivate 42% of users to log on daily.
- 35% of social media users follow influencers and creators for inspiration or lifestyle content.
- In the US, 29% of adults use social media for professional networking, especially on LinkedIn.
- Online communities, such as Reddit and Discord groups, attract 19% of users seeking shared interests.
- Customer support through DMs has become a mainstream channel, with 1 in 4 users saying they’ve reached a brand via social media in the past year.
- 15% of Gen Z users say they use platforms like TikTok as a search engine alternative to find food, fashion, or reviews.
- 9% of users globally say they now rely on social media as their primary source of news.
- Finally, around 15–18% turn to social media for work networking, communities, and following influencers.
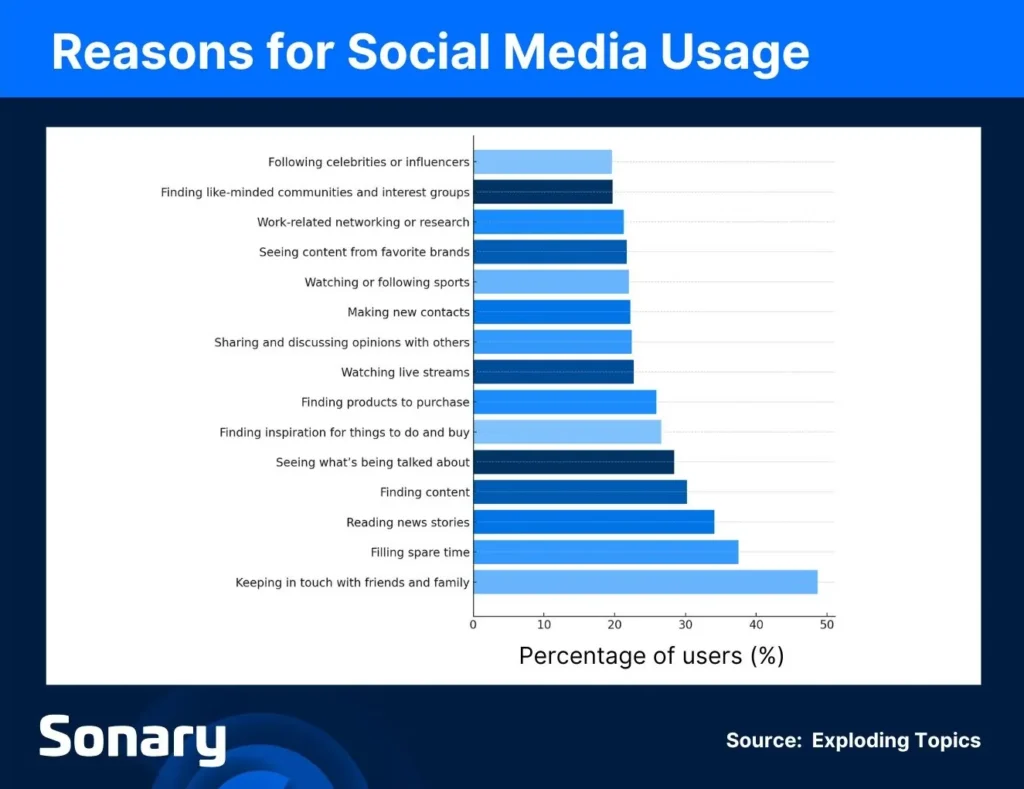
- The #1 reason users go on social media is to keep in touch with friends and family, with nearly 50% citing it.
- About 40% of users use it for filling spare time, showing its role as a go-to leisure activity.
- Reading news stories is a top activity for around 35% of users, making social media a major news source.
- Around 30% go online to find content, emphasizing the importance of entertainment and education in feeds.
- Finding inspiration for things to do or buy and seeing what’s trending also attracts nearly 30% of users.
- Approximately 25–28% use social platforms to watch live streams and discuss opinions, highlighting rising interactive engagement.
- Roughly 20–23% use social media for making new contacts, sports content, and brand-related updates.
- In the United States, YouTube and Facebook remain top platforms, but TikTok overtook Instagram among users under 24.
- South Korea has the highest per capita content uploads, particularly on YouTube and Naver.
- In India, WhatsApp is the most-used platform, followed by YouTube, Facebook, and Instagram.
- Brazilian users spend an average of 3 hours and 47 minutes daily on social media—the highest globally.
- In Japan, Twitter (now X) and LINE dominate, with LINE reaching 85% of mobile users.
- Germany shows high usage of Instagram and WhatsApp, while Facebook continues to decline, especially among users under 30.
- In Nigeria, short-form video apps like TikTok and Instagram Reels see growth rates above 15% annually.
- Indonesia ranks among the top five globally for Instagram Stories usage, with 81% of users posting weekly.
- Canada reports that 68.2% of its adult population are daily social media users, led by Facebook and YouTube.
- In Vietnam, TikTok is the fastest-growing app, with a 39% increase in DAU (daily active users) in the last year.
- The global average in 2025 stands at 2 hours and 28 minutes per day, slightly down from 2 hours and 31 minutes in 2024.
- The Philippines leads globally with 4 hours and 5 minutes of daily average time per user.
- In the United States, the average is 2 hours and 13 minutes, with TikTok and YouTube being the biggest time sinks.
- TikTok users now average 55 minutes daily, up from 52 minutes in 2024.
- Instagram users spend about 38 minutes per day, especially on Reels and Stories.
- Facebook usage is slightly declining, with an average of 33 minutes daily, down 5% YoY.
- YouTube retains one of the highest engagement durations, with 50+ minutes per day, especially among Gen Z and Millennials.
- LinkedIn sees significantly shorter sessions, averaging 7 minutes per day among active users.
- Pinterest users, mostly browsing via mobile, average 11 minutes per session but tend to visit multiple times a day.
- Twitter/X users clock in at 28 minutes per day, with news consumption and trending topics driving short bursts of activity.
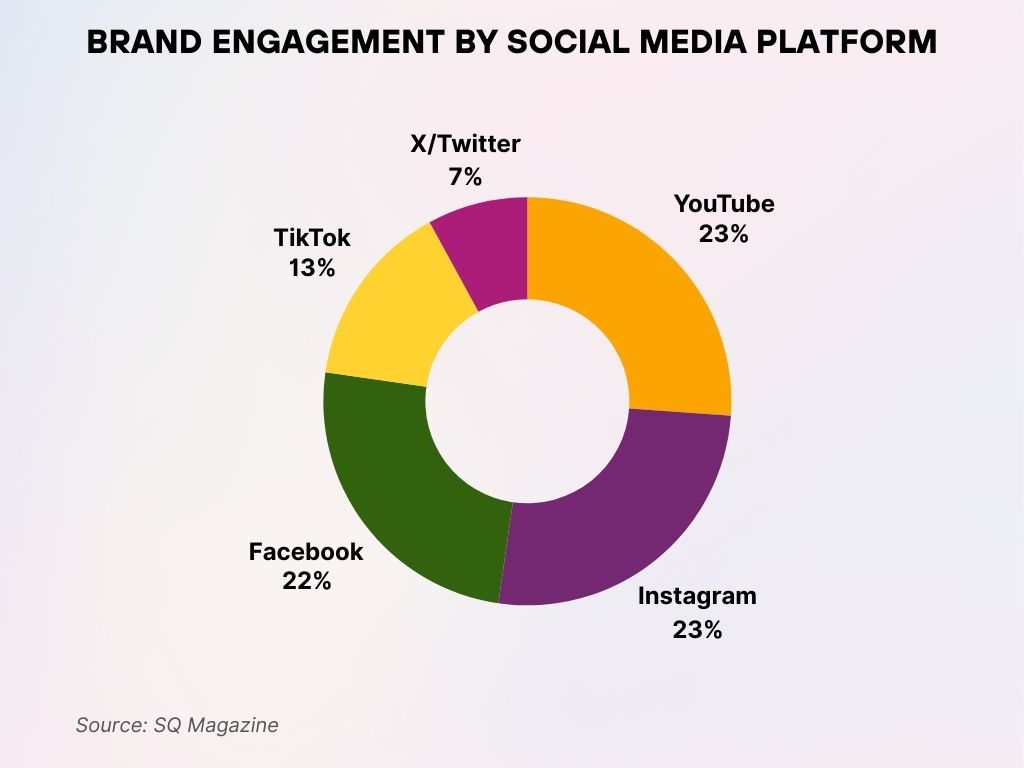
- X/Twitter ranks the lowest at 7%, highlighting a decline in brand engagement compared to other platforms.
- YouTube and Instagram are tied at the top, each generating 23% of brand engagement, proving that strong visual content is key.
- Facebook follows closely with 22%, showing it’s still highly relevant for brand interaction and community engagement.
- TikTok accounts for 13%, reflecting its growing presence but also showing room for brand strategy development.
Mobile vs Desktop Usage Patterns
- 96.2% of global users access social media via smartphones, while only 15.6% regularly use desktops.
- In the US, 89.5% of users prefer mobile-first browsing, with apps accounting for 82% of social media traffic.
- Instagram, TikTok, and Snapchat are overwhelmingly mobile-exclusive experiences.
- Desktop usage remains relevant on LinkedIn (used by 32% via desktop) and Reddit, where long-form reading is common.
- YouTube remains hybrid; 37% of US adults still watch content via smart TVs and desktops.
- In Europe, mobile usage dominates, but France and Germany show higher-than-average desktop interaction at 28% and 25% respectively.
- Mobile-first UI designs have driven a 12% improvement in user engagement rates across major platforms.
- Tablets contribute only 3.4% of social media browsing globally.
- In India, nearly 99% of users access platforms via mobile due to affordable smartphone penetration.
- 5G adoption has contributed to increased video streaming on mobile in regions like Southeast Asia and South America.
- Global social media ad spend is projected to hit $219.8 billion in 2025, up from $194.3 billion in 2024.
- Meta (Facebook, Instagram, WhatsApp) continues to dominate with over $134 billion in annual ad revenue.
- TikTok’s ad revenue crossed $18 billion, growing 29% YoY, driven by small businesses and creator partnerships.
- YouTube ads generated approximately $41 billion, powered by Shorts, pre-rolls, and content partnerships.
- Snapchat saw an increase in AR ad sales, reaching $4.6 billion, up from $3.9 billion last year.
- Pinterest’s ad revenue jumped to $3.1 billion, with lifestyle and e-commerce brands leading the charge.
- LinkedIn ads brought in over $6.5 billion, bolstered by B2B spending and AI-driven targeting tools.
- Instagram Reels monetization has grown by 44% YoY, particularly through affiliate link integrations.
- Twitter/X, despite turbulence, generated $2.4 billion in 2025, thanks to political campaigns and news publishers.
- Retail and e-commerce brands accounted for 31% of global ad spend across social platforms.
- 10% of marketers’ media budgets will be redirected into social commerce initiatives.
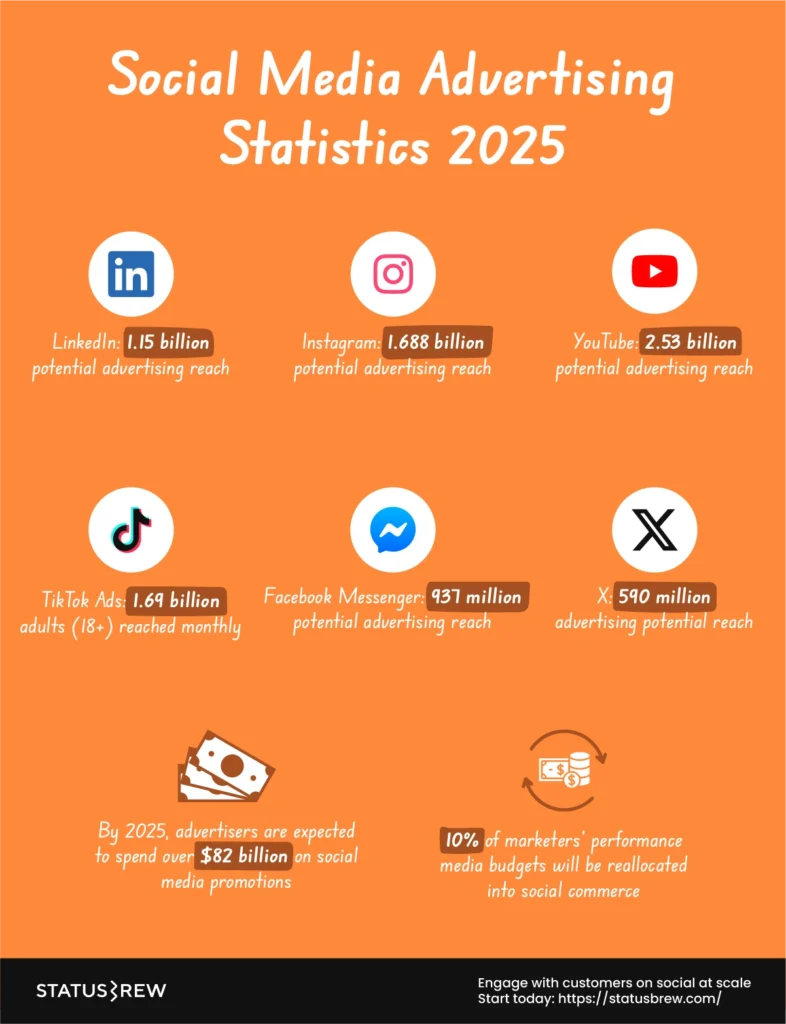
- YouTube has a potential advertising reach of 2.53 billion, the highest among all platforms in 2025.
- Instagram reaches 1.688 billion users, making it a top choice for global ad campaigns.
- TikTok Ads connect with 1.69 billion adults monthly, excelling with the 18+ demographic.
- LinkedIn offers 1.15 billion in advertising reach, ideal for targeting professionals.
- Facebook Messenger enables advertisers to reach 931 million users globally.
- X (formerly Twitter) provides an ad reach of 590 million, suited for niche and real-time campaigns.
- Advertisers are expected to spend over $82 billion on social media promotions by 2025.
Influencer Marketing Growth Trends
- Influencer marketing spending in 2025 is projected to reach $30.8 billion, up 15.4% from 2024.
- Nano-influencers (1K–10K followers) deliver the highest engagement, averaging 3.8% ER (engagement rate) across all platforms.
- Instagram remains the top platform for influencer campaigns, hosting 79% of all brand collaborations.
- TikTok influencer partnerships rose 23% YoY, especially in fashion, beauty, and gaming niches.
- YouTube creators saw a 17% increase in sponsorship revenue, thanks to long-form product reviews and tutorials.
- Gen Z creators dominate campaigns, with 62% of influencer collaborations now targeting audiences under 30.
- Affiliate link usage among influencers is up 34%, especially through Instagram Stories and TikTok captions.
- In the US, 71% of marketers plan to increase influencer budgets in 2025.
- AI-powered influencer discovery platforms are being used by 48% of brands, streamlining outreach and ROI analysis.
- Virtual influencers (AI-generated avatars) are gaining traction, with an estimated market size exceeding $1.6 billion in 2025.
Engagement Rates Across Platforms
- TikTok leads all platforms with an average engagement rate of 5.4% per post, far surpassing others.
- Instagram Reels sees an average 1.22% engagement rate, while carousel posts trail at 0.96%.
- Facebook’s average engagement has dipped to 0.48%, with photo posts slightly outperforming links and text.
- LinkedIn posts average 0.67% engagement, but long-form thought leadership and polls outperform standard updates.
- YouTube has a subscriber engagement rate of 1.6%, heavily influenced by video length and comment interaction.
- Pinterest’s engagement holds steady at 0.57%, especially for recipe and home decor pins.
- Snapchat stories boast high open rates (averaging 55%), but swipe-up interactions are at 7.3%.
- Threads, Meta’s microblogging app, shows early promise with an average 0.84% engagement rate in 2025.
- Reddit experiences strong niche engagement with subreddits averaging 6–10 comments per active post.
- X (formerly Twitter) dropped below 0.3% average engagement, though trending topics and live events still drive spikes.
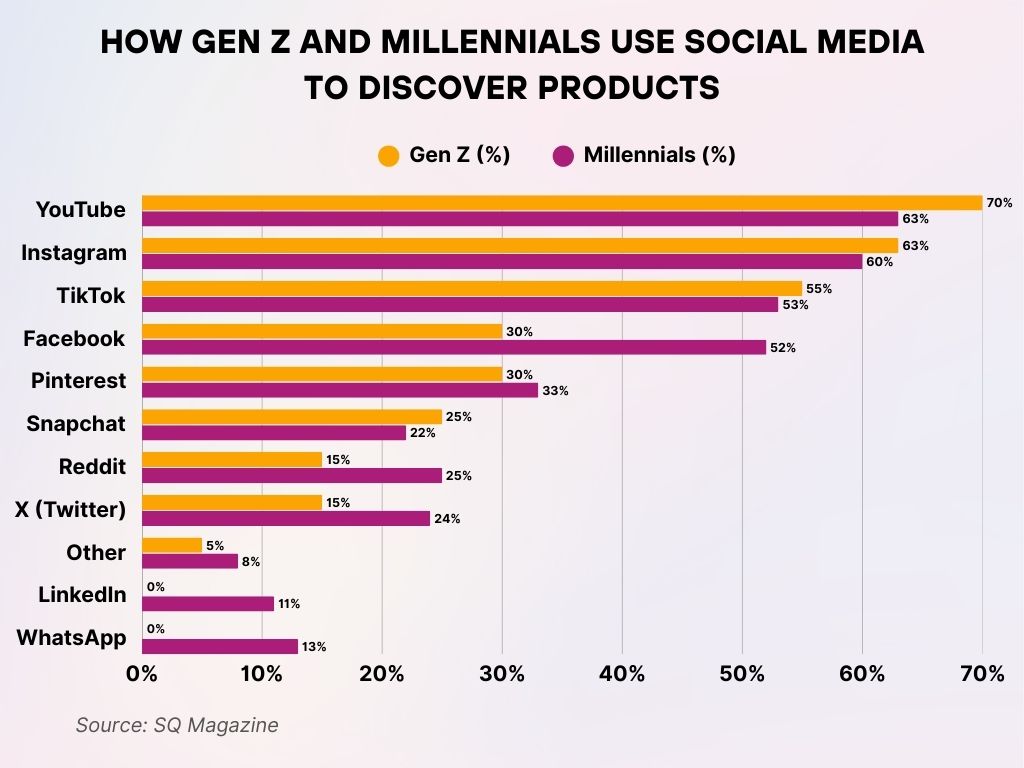
- YouTube is the top choice for both groups, used by 70% of Gen Z and 63% of Millennials for product research.
- Instagram closely follows, with 63% of Gen Z and 60% of Millennials relying on it for discovering products.
- TikTok is slightly more favored by Gen Z (55%) compared to Millennials (53%), highlighting its youth appeal.
- Facebook shows a big generational gap, used by only 30% of Gen Z versus 52% of Millennials.
- Pinterest is fairly even, attracting 30% of Gen Z and 33% of Millennials for product discovery.
- Snapchat is preferred more by Gen Z (25%) than by Millennials (22%), consistent with its younger user base.
- Reddit flips the trend, being used by 25% of Millennials compared to 15% of Gen Z.
- X (formerly Twitter) is similar, with 24% of Millennials using it vs only 15% of Gen Z.
- Other platforms are used by 5% of Gen Z and 8% of Millennials for product research.
- LinkedIn sees 11% usage among Millennials, but 0% among Gen Z, reflecting its professional niche.
- WhatsApp is used by 13% of Millennials, while Gen Z reports 0% usage for product discovery.
- 53.2% of users say they’ve made a purchase directly through a social platform in the last 30 days.
- Instagram Shops generate over $53 billion in revenue, driven by seamless in-app checkout.
- TikTok Shop has exploded in popularity, reaching $24.7 billion in gross merchandise value (GMV) in 2025.
- Pinterest leads in purchase intent, with 70% of users reporting they use the platform to plan or research purchases.
- Facebook Marketplace has grown to support over 1 billion monthly users, up 11% YoY.
- YouTube Shopping integrations allow creators to link products mid-video, with shoppable videos increasing conversions by 23%.
- Live commerce, especially on TikTok and Instagram, contributes to 17% of social commerce sales in the US.
- Shopify merchants report that 41% of their traffic now originates from social platforms.
- WhatsApp Business is used by more than 200 million users, with its catalog and chat-commerce features widely adopted in Asia and South America.
- AR try-on features from brands like Sephora and IKEA have boosted conversion rates by up to 32%.
Privacy and Data Sharing Statistics
- 79% of global users are concerned about how platforms handle their data.
- In the US, 62% of adults say they feel “watched” by social media algorithms.
- TikTok, under increased regulatory scrutiny, now offers expanded transparency tools, including ad-tracking opt-outs.
- Meta reports that over 1.4 million users per month adjust their ad preference settings.
- California’s CPRA has led to a 23% drop in third-party data sharing for platforms serving users in that state.
- Apple’s App Tracking Transparency continues to impact ad efficiency, with a 38% drop in conversion tracking accuracy across iOS.
- Instagram and Facebook launched updated privacy dashboards, visited by 18% of active users in the past year.
- Europe’s GDPR fines reached €2.2 billion in 2024, up from €1.5 billion the year before, largely targeting social media platforms.
- Telegram and Signal saw a 19% growth in active users, citing “privacy-first” as their top reason for joining.
- 73% of Gen Z users say they are more cautious about what they post than they were a year ago.
- 91% of Gen Z (ages 12–27) use social media daily, with an average screen time of 3 hours and 42 minutes.
- Millennials (ages 28–43) favor Instagram, YouTube, and Facebook, using social media for a mix of content, shopping, and networking.
- TikTok is the primary discovery platform for 46% of Gen Z when looking for music, news, or lifestyle content.
- BeReal and other “authentic moment” apps saw a 12% decline in active users in 2025, after peaking in 2023.
- Gen Z users are 3x more likely than Baby Boomers to follow and engage with virtual influencers.
- Social media fatigue affects 1 in 4 Gen Z users, with many reducing screen time or using “quiet modes.”
- Millennials remain the top demographic for Facebook Groups and long-form YouTube consumption.
- Short-form video still dominates Gen Z engagement, but many report shifting interest toward more informative and value-based content.
- 90% of Gen Z users say they care about whether content is “real” and unscripted.
- Memes remain a top content format, with 72% of Gen Z sharing or saving memes weekly.
- 93% of US businesses maintain at least one active social media profile in 2025.
- LinkedIn is used by 95% of B2B marketers, with 68% calling it their most effective platform.
- Instagram and Facebook remain popular with small businesses, with over 30 million active SMB pages globally.
- X (formerly Twitter) is used by 59% of tech companies to broadcast updates and join public discussions.
- YouTube is utilized by 78% of B2B brands for webinars, tutorials, and thought leadership content.
- Social selling (direct outreach via DMs or comment threads) is cited by 61% of B2B marketers as their top lead-generation tactic.
- Reels and Shorts have seen a 31% increase in usage by B2B brands for behind-the-scenes and explainer content.
- B2B influencer collaborations have grown by 22% YoY, especially in software, HR, and fintech.
- AI-driven social analytics tools are used by 72% of marketers to optimize content strategy.
- Employee advocacy programs (encouraging employees to post company content) boosted reach by 28% on average.
- AI and predictive analytics are used by 67% of brands to forecast content trends and schedule posts accordingly.
- Instagram Insights now includes deeper Reel performance data, including audio metrics and retention curves.
- TikTok Creator Tools expanded in 2025 to offer post-level ROI tracking for brand partners.
- Meta Business Suite now includes cross-platform benchmarking, helping brands compare performance across Facebook and Instagram.
- Sentiment analysis tools powered by NLP are used by 51% of agencies to track brand perception in real time.
- YouTube’s analytics suite now breaks down user journeys—from ad exposure to channel subscription.
- Social listening platforms like Brandwatch and Sprout Social saw a 33% increase in enterprise adoption in 2025.
- LinkedIn analytics added career-stage segmentation, allowing B2B marketers to tailor messaging by job seniority.
- Snapchat Insights now offers AR-specific campaign performance metrics, including filter reuse rate.
- Real-time dashboard tools, like Metricool and Hootsuite, are used by 80% of mid-sized brands to stay agile.
Conclusion
The social media landscape in 2025 is complex, fast-moving, and more deeply intertwined with daily life than ever before. With over 5.17 billion users, platforms have evolved beyond connection and entertainment—they now drive global commerce, influence politics, shape identity, and fuel entire industries.
Whether you’re a brand, a creator, or a casual scroller, understanding these statistics isn’t just helpful—it’s essential. As algorithms evolve, user behaviors shift, and privacy standards tighten, staying informed is the first step to staying relevant in the world of social media.
Sources
- https://datareportal.com/social-media-users
- https://www.statista.com/topics/1164/social-networks/
- https://www.searchlogistics.com/learn/statistics/social-media-user-statistics/
- https://www.statista.com/statistics/433871/daily-social-media-usage-worldwide/
- https://backlinko.com/social-media-users
- https://gs.statcounter.com/social-media-stats
- https://socialbee.com/blog/social-media-statistics/
- https://statusbrew.com/insights/social-media-statistics

