In early 2025, something fascinating happened at a small community center in suburban Ohio. A town hall meeting about local road closures suddenly went viral, not because of the topic, but because a 74-year-old attendee live-tweeted the entire event using her iPad. Within hours, her posts racked up thousands of likes and replies from people across the country. This small moment reflects a much larger trend: Twitter (now rebranded as X) continues to reinvent how people communicate in real time.
Whether it’s political commentary, breaking news, celebrity rants, or grassroots activism, Twitter remains a critical player in the global conversation. As we move deeper into 2025, it’s not just about how many users Twitter has, but who they are, how they engage, and what that means for businesses, brands, and culture.
Editor’s Choice
- Twitter has surpassed 610 million total users globally as of Q1 2025.
- Roughly 76% of Twitter users access the platform daily, a year-over-year increase of 9.8%.
- The U.S. remains the largest single user base, contributing over 94 million users as of January 2025.
- Tweets with videos receive 2.5x more engagement than those without any media.
- Twitter Blue subscriptions grew by 18% year-over-year, hitting 15.3 million paying users globally.
- The average time users spend on Twitter each day is now 31.5 minutes, up from 28.2 minutes in 2024.
- Hashtag usage has declined 11% compared to 2023, indicating a shift toward threaded conversations and visual content.
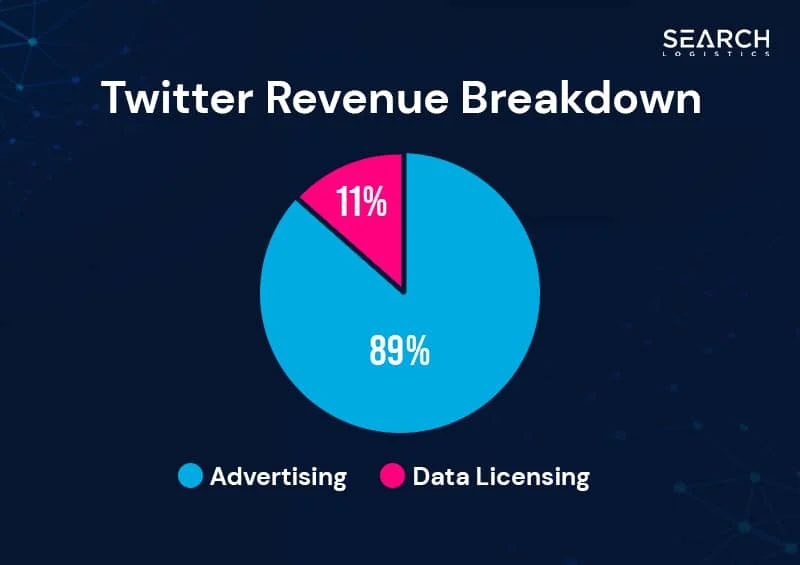
Twitter Revenue Breakdown: Advertising Dominates
- Advertising accounts for 89% of Twitter’s total revenue, making it the platform’s primary income source by a large margin.
- Data licensing contributes 11% to Twitter’s revenue, showing that monetization through user data remains a smaller but notable stream.
Total Number of Twitter Users Worldwide
- As of April 2025, Twitter has an estimated 610 million total users, reflecting a 4.8% growth from 2024, which clearly highlights Twitter’s growth trend after recent platform changes.Active users (monthly) account for approximately 410 million of the total user base.
- Active users (monthly) account for approximately 410 million of the total user base.
- Since Elon Musk’s acquisition and the subsequent platform changes, Twitter’s user base has rebounded, growing steadily since the dip in mid-2023.
- In comparison, Twitter had just 368 million monthly active users in January 2023.
- India ranks as the second-largest user base, with over 54 million active users, growing at a 12% YoY rate.
- Brazil’s user base reached 23 million in 2025, driven by increased adoption among Gen Z.
- Twitter Lite, designed for low-bandwidth regions, contributed to over 35 million active users, especially across Southeast Asia.
- As of Q1 2025, Twitter bots are estimated to account for 5.1% of all active profiles, slightly lower than the 6.2% observed in 2023.
- Twitter Spaces hosts 3.2 million sessions per month, an increase of 14% over the previous year.
- Twitter’s global reach now extends to over 200 countries, with translation support in 46 languages.
Twitter’s Monthly Active Users by Region
- North America accounts for 110 million MAUs, with the U.S. making up over 85% of that figure.
- Europe reports 78 million monthly active users, with the UK, Germany, and France leading the charge.
- Asia-Pacific is the fastest-growing region, now with over 152 million MAUs, a 6.7% increase from 2024.
- Africa and the Middle East combined host 48 million MAUs, driven by mobile-first internet adoption.
- Latin America has 53 million monthly users, with Mexico (19M) and Brazil (23M) dominating regional numbers.
- In 2025, Japan remains the most active user base per capita, with users tweeting 3.8x more frequently than the global average.
- Australia holds steady with 12 million monthly users, a 3.2% increase compared to last year.
- Indonesia grew its MAU base to 19 million, aided by smartphone penetration and political discourse online.
- Canada’s user base reached 13 million MAUs, maintaining its position as a top-10 Twitter market.
- Regional ad targeting based on MAU density has increased Twitter’s CTR by 22% in international markets.
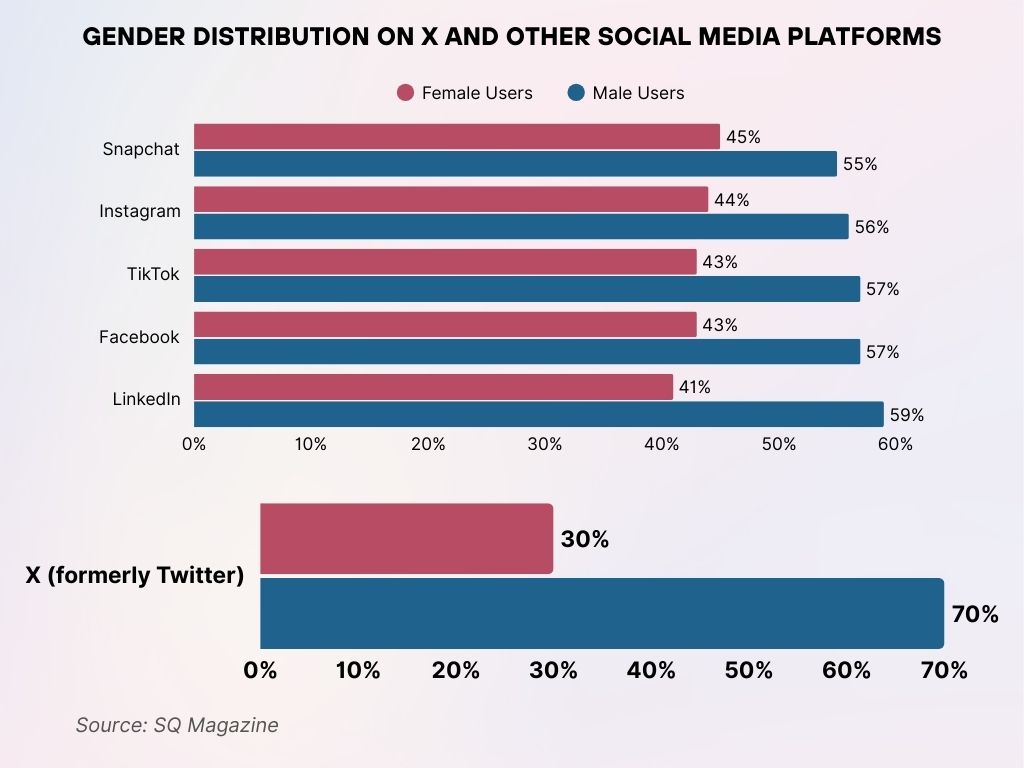
Gender Distribution on X and Other Social Media Platforms
- X (formerly Twitter) has the highest male user base, with 70% male and only 30% female users, showing a significant gender gap.
- LinkedIn shows a 59% male and 41% female split, highlighting a male-dominated audience, especially among professionals.
- Facebook and TikTok both have 57% male users, while female users account for 43%, reflecting consistent gender trends.
- Instagram follows closely with 56% male and 44% female users, indicating a slightly better gender balance.
- Snapchat stands out as the most balanced platform in the list, with 55% male and 45% female users.
Daily Active Users and User Engagement Trends
- Twitter now averages 288 million daily active users (DAUs) globally in 2025.
- 60% of DAUs post at least once daily, while 22% engage solely through likes, retweets, or replies.
- Tweets with polls receive 22% higher interaction rates, especially during live events.
- In 2025, the average Twitter user follows 130 accounts, but only engages with around 11% of their timeline.
- Threads are now the most consumed format, making up 27% of all engagement clicks, up from 19% in 2024.
- Trending topics in 2025 are 18% more likely to originate from non-English tweets, showing a global diversification in what drives conversation.
- User mentions in replies have risen by 12%, indicating more direct engagement rather than one-way posting.
- Users who use Twitter on mobile are 2.3x more likely to engage than desktop-first users. Power users who rely on multi-account management also show higher session frequency, as they switch between profiles to track niche conversations in real time.
- Tweet views are now a default metric, with users seeing an average of 15,600 tweet views per month.
- Engagement from verified accounts contributes to 42% of all tweet interactions, highlighting the continued value of identity-based participation.
Demographics of Twitter Users (Age, Gender, Location)
- As of 2025, 57.3% of Twitter’s global user base is male, while 42.7% is female.
- The largest age group on Twitter is 25–34 years, making up 38.6% of all users worldwide.
- Users aged 18–24 account for 26.2%, showing a sharp rise in Gen Z participation since 2023.
- Users 55+ now represent 6.8% of the user base, a small but steadily growing segment.
- In the United States, urban dwellers make up 66% of Twitter’s active users.
- Millennials (27–42) remain the most engaged generation, with daily usage rates exceeding 71%.
- Twitter sees the highest engagement rate among users with postgraduate education, at 54%.
- 82% of Twitter’s U.S. users speak English, followed by Spanish and Chinese.
- New York, Los Angeles, and Chicago are the top U.S. cities by user count, each hosting over 3 million active users.
- Twitter penetration among U.S. teens (13–17) is 12.5%, compared to 39% on TikTok.
US Twitter Users Forecast (2020–2025)
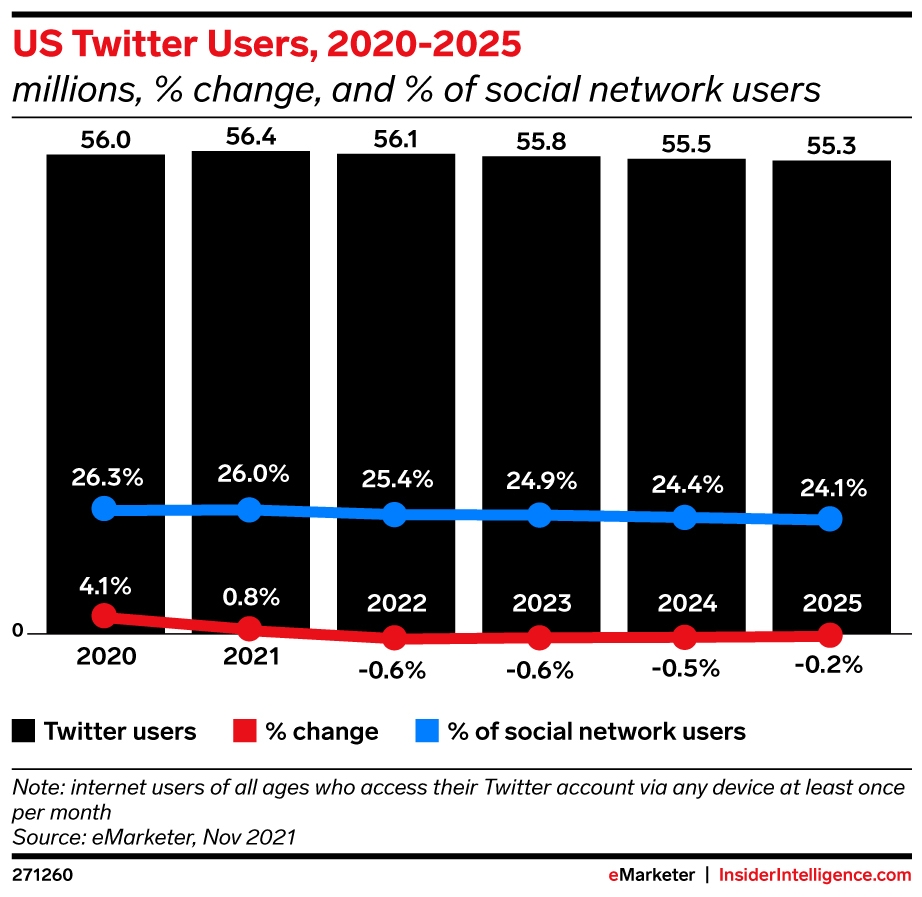
- In 2020, there were 56.0 million Twitter users in the US, accounting for 26.3% of social network users, with a 4.1% growth rate.
- 2021 saw a slight increase to 56.4 million users, with a 26.0% share and only 0.8% growth, signaling a slowdown.
- In 2022, user count slightly dipped to 56.1 million, and growth turned negative at -0.6%, making up 25.4% of social network users.
- 2023 continued the decline with 55.8 million users and a -0.6% change, now 24.9% of the total social media audience.
- By 2024, users dropped to 55.5 million with a -0.5% growth, accounting for 24.4% of social network users.
- The downward trend persisted in 2025, with 55.3 million users, a -0.2% drop, and 24.1% share of the social network market.
Twitter Usage by Industry and Profession
- In 2025, 61% of journalists use Twitter daily, making it the most-used platform among media professionals.
- Tech professionals represent 13.4% of Twitter’s verified accounts.
- Education and academia account for 9.6% of the top 1 million followed accounts.
- Healthcare professionals have seen a 21% uptick in Twitter use, largely for public health communications.
- Marketing professionals spend an average of 44 minutes/day on the platform, the highest across sectors.
- Government accounts (local, state, and federal) now total over 210,000 globally.
- Lawyers and legal advisors saw a 19% rise in Twitter engagement for brand-building and networking.
- Entertainment and influencer accounts generate the highest retweet rates, at an average of 18.2% per tweet.
- Cryptocurrency and Web3 professionals make up 6.2% of professional bios analyzed.
- Startups use Twitter primarily for brand awareness, with 89% reporting higher visibility compared to Instagram or LinkedIn.
Top Countries by Twitter User Count
- The United States leads with 94.4 million users as of Q1 2025.
- India follows with 54.1 million active users, growing rapidly due to youth smartphone access.
- Japan holds steady at 50.2 million users, maintaining its unique content culture and extremely high tweet frequency.
- Brazil ranks fourth with 23.4 million users, largely mobile-first.
- Indonesia hosts 19.3 million users, with heavy engagement during political seasons.
- Mexico now has 17.8 million users, up from 15 million in 2023.
- The United Kingdom clocks in at 17.1 million users, down slightly year-over-year.
- The Philippines experienced a 6% user growth, reaching 14.9 million.
- Canada now has 13.2 million users, maintaining steady engagement from both individuals and brands.
- Germany, with 11.8 million users, ranks in the global top 15 and shows increasing usage among professionals and tech workers.
Top Countries by Number of X (formerly Twitter) Users
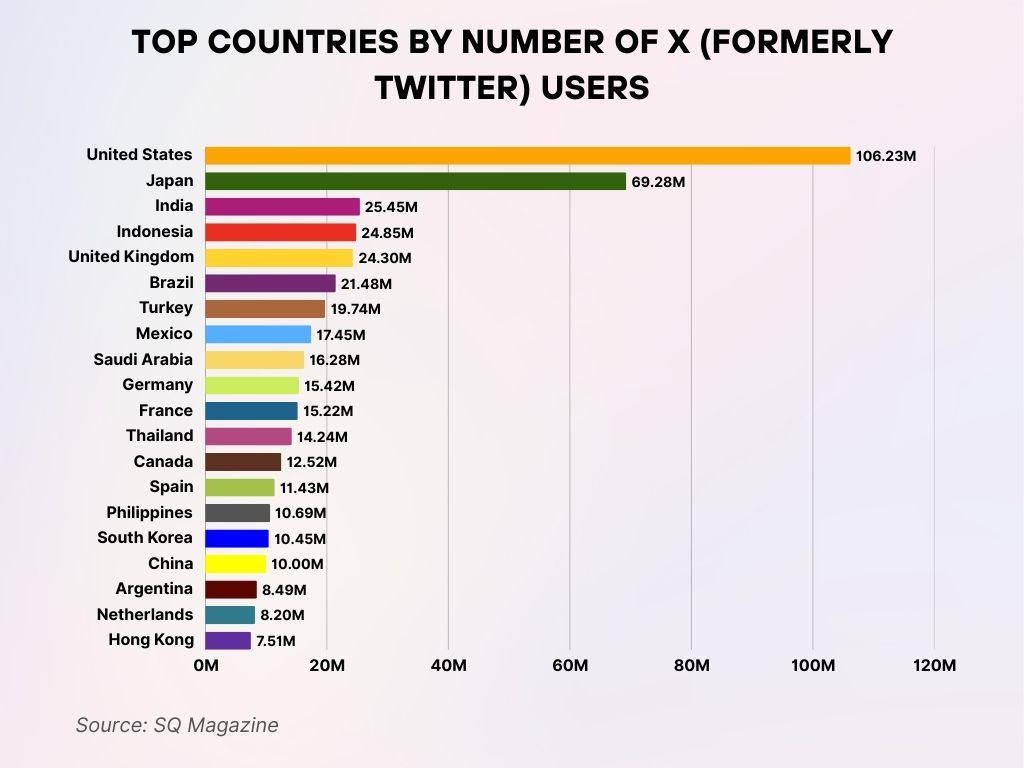
- The United States leads globally with 106.23 million X users, showcasing its dominant position in the platform’s user base.
- Japan ranks second with 69.28 million users, making it the highest-ranking Asian country on the list.
- India follows with 25.45 million users, just ahead of Indonesia’s 24.85 million, indicating strong engagement in South Asia.
- The United Kingdom records 24.3 million users, slightly behind Indonesia, maintaining a solid European presence.
- Brazil comes in next with 21.48 million users, highlighting South America’s growing activity on X.
- Other notable countries include Turkey (19.74M), Mexico (17.45M), and Saudi Arabia (16.28M), reflecting diversified regional engagement.
- Germany (15.42M) and France (15.22M) round out the top European nations actively using the platform.
- Smaller but significant user bases include Thailand (14.24M), Canada (12.52M), Spain (11.43M), and the Philippines (10.69M).
- Even China (10M) and South Korea (10.45M) appear on the list despite platform restrictions and competition.
- Argentina, the Netherlands, and Hong Kong have between 7.5M and 8.5M users, representing notable engagement from smaller populations.
Mobile vs Desktop Twitter Usage Statistics
- In 2025, 83% of users access Twitter via mobile, while only 17% use desktops regularly.
- Mobile-first users spend 34% more time per session compared to desktop users.
- Desktop tweets average higher link CTRs, especially for B2B and news content.
- TweetDeck usage dropped by 12% after being locked behind the premium tier (Twitter Blue).
- Mobile notifications drive 54% of user re-engagement within the first 24 hours.
- Twitter’s Android app leads global usage, with 53% of mobile activity coming from Android devices.
- iOS users are 28% more likely to subscribe to premium features, like Twitter Blue.
- Users on tablets average 1.4x more video plays, though they account for only 6% of mobile traffic.
- Twitter Lite accounts for 9% of all mobile traffic, especially in emerging markets.
- Voice tweeting is used by only 3.5% of mobile users, despite being introduced two years ago.
User Growth Trends Over the Last Five Years
- In 2021, Twitter had 396 million total users. By 2025, that figure grew to 610 million, marking a 54% increase in four years.
- The platform saw its sharpest user dip in 2022 after acquisition shifts, dropping to 361 million monthly actives.
- User growth rebounded by 2023, climbing back to 410 million MAUs after structural updates and new features.
- Asia-Pacific contributed 58% of all new users between 2021–2025.
- Africa experienced 72% user growth over five years, driven by mobile adoption and political discourse.
- Annual global growth averaged 5.8%, with 2024 showing the highest YoY gain at 7.1%.
- Teen user acquisition has been flat, growing only 1.9% annually since 2021.
- Verification and monetization incentives helped boost content creators’ retention by 22% over five years.
- Female user growth outpaced male user growth by 3.7% annually, with notable gains in the Middle East and North Africa.
- Languages other than English account for 51% of all new users since 2021, a shift from 41% in 2020.
Twitter Engagement Rate by Industry (Per Tweet)
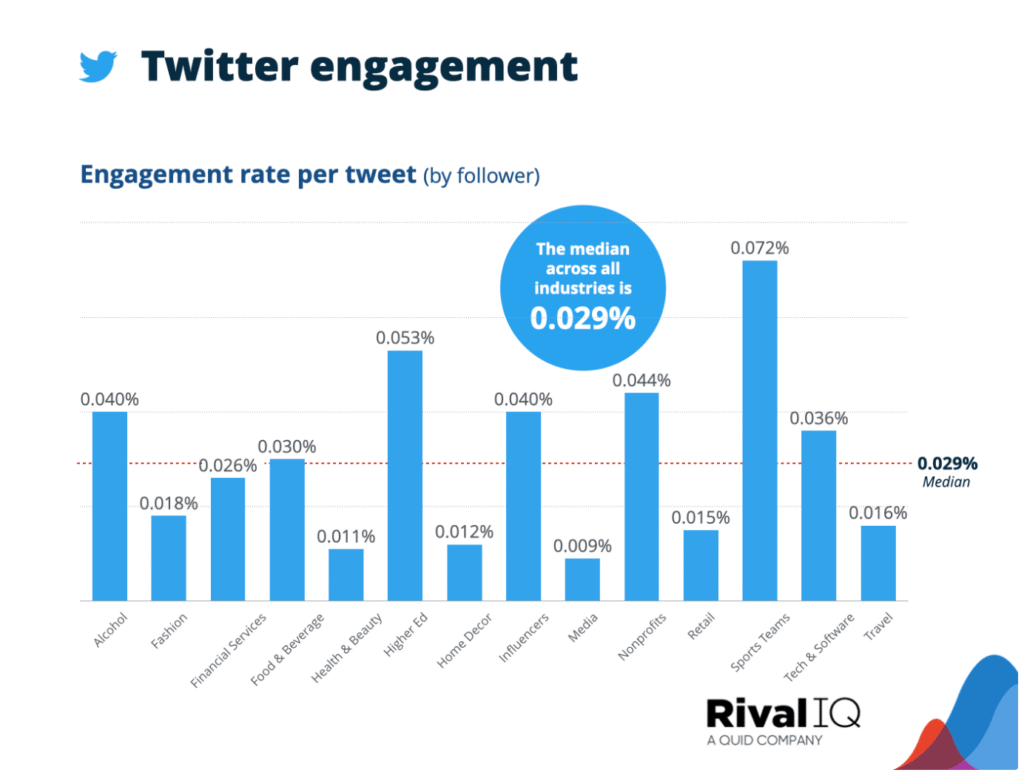
- The median Twitter engagement rate across all industries is 0.029%, setting a benchmark for comparison.
- Sports Teams top the chart with the highest engagement rate at 0.072%, more than double the industry median.
- Higher Education also performs well, recording an engagement rate of 0.053%, indicating strong follower interaction.
- Nonprofits and Alcohol brands both achieve 0.044% and 0.040%, respectively, placing them above the industry median.
- Media (0.009%) and Health & Beauty (0.011%) have the lowest engagement rates, falling well below average.
- Other sectors like Food & Beverage (0.030%), Tech & Software (0.036%), and Influencers (0.040%) also outperform the median.
- Industries such as Fashion (0.018%), Retail (0.015%), and Travel (0.016%) lag in engagement per tweet.
Twitter Verification and Subscription Metrics (Blue, Gold, Gray)
- As of Q1 2025, Twitter Blue subscribers number 15.3 million, up from 13 million in 2024.
- Gold checkmarks, designated for verified business entities, are held by 231,000 accounts worldwide.
- Gray checkmarks, used by government agencies and officials, number just over 96,000 globally.
- Twitter Blue revenue exceeded $198 million in the past 12 months, growing by 22.4% YoY.
- 68% of Twitter Blue subscribers are based in North America, with the U.S. contributing 82% of total subscription revenue.
- Only 9% of all verified accounts post daily, though their content receives 42% of total engagement platform-wide.
- Verification boosts visibility by 25% on average, particularly for tweets with media or links.
- Paid accounts see 1.6x higher engagement rates, especially on desktop.
- Subscription cancellations dropped 14% in Q1 2025, attributed to bundled perks like higher ranking in replies.
- Blue-tier users post 2.1x more threads and polls compared to non-verified users.
Most Followed Accounts and Popular Hashtags
- Elon Musk remains the most followed person, with 179 million followers as of March 2025.
- Taylor Swift and Narendra Modi round out the top three, with 163M and 148M followers, respectively.
- @TwitterSports is the most followed brand account, with 91.5 million followers.
- The top 5 most retweeted tweets of 2025 (so far) all relate to climate change and global events, with each surpassing 1.2 million retweets.
- The hashtag #AI2025 has trended in over 30 countries, peaking at 1.6M uses in a single week.
- #Oscars2025 was the most tweeted entertainment hashtag, used over 11.2 million times during the awards week.
- #ElectionWatch became a global trend during the recent European Parliament elections, with over 8.4 million tweets.
- #CryptoCrash trended globally in February 2025 after Bitcoin fell 27% in a day, generating 6.3 million tweets.
- @YouTube and @NASA continue to top engagement charts, both with consistently high replies and retweets per post.
- Hashtags in non-English languages make up 34% of trending topics weekly, showing increasing global diversity.
Twitter User Demographics by Age Group
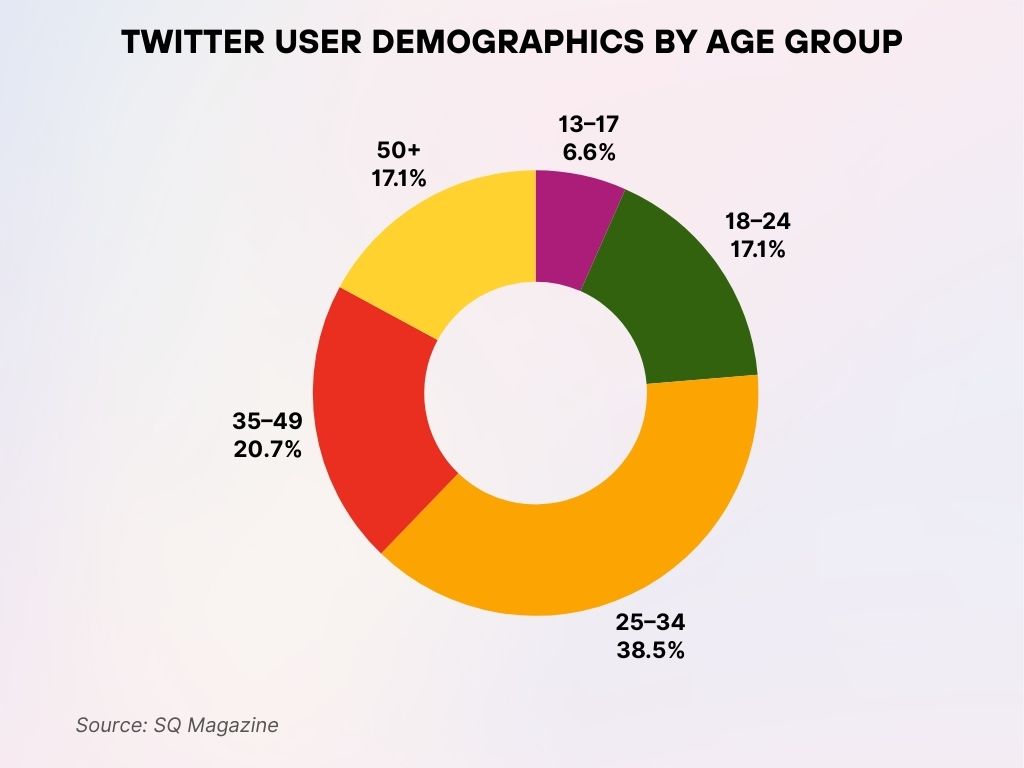
- The largest share of Twitter users falls within the 25–34 age group, making up 38.5% of the total user base.
- Users aged 35–49 account for 20.7%, representing the second-largest demographic on the platform.
- Both the 18–24 and 50+ age groups each hold an equal share of 17.1% of users, showing balanced usage across young adults and older users.
- The 13–17 age group comprises the smallest portion, with only 6.6% of Twitter users coming from this segment.
Twitter User Behavior During Major Events and News Cycles
- During global breaking news, Twitter sees a 27% spike in DAUs within the first hour.
- The January 2025 solar flare alert prompted 3.1 million tweets in under 6 hours.
- Live events like the Super Bowl and FIFA qualifiers push tweet volume to 2,200 tweets per second.
- Twitter Spaces usage surges 3x during major events, particularly for political and news discussions.
- Political events drive the most impressions, averaging 2.9 billion views during U.S. primaries.
- Emotional response tweets (e.g., reactions, gifs) spike by 38% during crises and emergencies.
- Emergency agencies using gray checkmarks see a 44% higher response rate during live alerts.
- Hashtag hijacking increases 18% during controversial news events, requiring enhanced moderation.
- Verified journalists tweeting in real time receive 5.7x more engagement than non-verified counterparts.
- During the Academy Awards, tweets with embedded video clips gained 3x more reach than plain text commentary.
Advertising Reach and Engagement on Twitter
- Twitter’s ad reach stands at 545 million users globally as of April 2025.
- Average ad CTR on Twitter is 1.39%, slightly higher than LinkedIn and on par with Facebook.
- Video ads have a 2.6x higher engagement rate than image-based campaigns.
- The cost-per-click (CPC) averages $0.62, a slight drop from $0.68 in 2024.
- U.S. advertisers see the highest ROAS (return on ad spend), averaging 4.1x across verticals.
- Brands using Twitter Threads as sponsored content saw 17% more interaction than single-tweet promotions.
- Retail and fashion brands have the highest organic reach, especially during launch events.
- Promoted trends cost between $140K–$250K/day, depending on targeting scope and region.
- Engagement is 3.4x higher for ads shown during live events, especially sports or global news.
- Brands with verified business accounts (Gold check) receive 2.8x higher user trust metrics according to internal polling.
Twitter User Retention and Churn Rates
- Monthly retention sits at 72.6%, up from 70.1% in 2024.
- New users retained after 90 days stand at 38.2%, the highest since 2021.
- Twitter Blue subscribers retain at a rate of 82%, significantly higher than free-tier users.
- Content creators who tweet daily have a 90-day retention of 64%, up from 57% last year.
- Bots and low-activity accounts make up 6.3% of churn, slightly down YoY.
- Users who follow at least 20 accounts are 3.1x more likely to remain active after 30 days.
- Thread authors retain better than single-tweet users, with a 24% lower churn rate.
- Push notifications improve 7-day retention by 31%, especially for trending alerts.
- Onboarding flows redesigned in late 2024 improved sign-up-to-first-tweet conversion by 42%.
- User churn is highest in regions with political instability, particularly in Central Asia and Eastern Europe.
Recent Developments in Twitter User Base and Platform Changes
- Twitter’s rebranding to “X” in mid-2024 has not negatively affected user growth, according to internal metrics.
- Integration of long-form content (up to 25,000 characters) increased average time-on-site by 15.4%.
- X Hiring, the platform’s job listing feature, now has over 64,000 active job posts.
- Community Notes participation has grown by 28%, with 5.1 million active contributors.
- AI-powered moderation tools launched in early 2025, reducing harmful content visibility by 43%.
- Twitter Circle sunset in March 2025, due to limited usage and overlap with Communities.
- Cross-posting to Instagram and Facebook is now integrated, increasing average post reach by 11%.
- Spaces monetization launched, enabling creators to earn via ticketed events, used by 14,500 hosts so far.
- Auto-translate in DMs and tweets increased by 3.2x usage, driven by global conversation growth.
- X is piloting decentralized identity features, aimed at reducing fake accounts and streamlining verification.
Conclusion
Twitter’s transformation into “X” hasn’t diminished its cultural relevance, instead, it has opened new doors for functionality, monetization, and real-time global discourse. From daily micro-interactions to billion-tweet events, the platform remains a pulse point for news, opinion, and connection.
In 2025, Twitter is more than a social media app, it’s a platform where user behavior shapes narratives, subscriptions redefine engagement, and real-time data fuels both community and commerce. As the platform evolves, businesses and users alike must pay close attention to the data to unlock its full potential.

