Introduction
In 2010, a small coffee shop in Portland decided to run its first Facebook ad. The owner spent just $20, targeting locals within a 5-mile radius. The result? A weekend rush that nearly tripled their regular traffic. Fast forward to 2025, and stories like this are no longer the exception, they’re the expectation.
Social media advertising has matured into a powerhouse industry with billions of dollars in play. From small businesses to Fortune 500s, everyone is vying for visibility in our endlessly scrolling feeds. In this article, we’ll unpack the latest 2025 social media advertising statistics, providing a clear snapshot of where the industry is, where it’s heading, and what that means for marketers right now.
Editor’s Choice
- Global social media ad spend is projected to reach $247.3 billion in 2025, up from $221.6 billion in 2024.
- Facebook remains the most-used platform for marketers, with 89% of global marketers investing in Facebook ads in Q1 2025.
- TikTok ad revenue is forecasted to hit $23.1 billion in 2025, a 17.5% increase from 2024.
- The average ROI from paid social media advertising increased to $5.28 for every $1 spent in 2025.
- Video ads across all platforms saw a 23% higher engagement rate than static image posts in early 2025.
- Mobile users account for 92.4% of all social media ad clicks globally in 2025.
- LinkedIn ad revenue in North America grew by 14% year-over-year, reaching $4.7 billion in 2025.
Global Social Media Advertising Market Growth
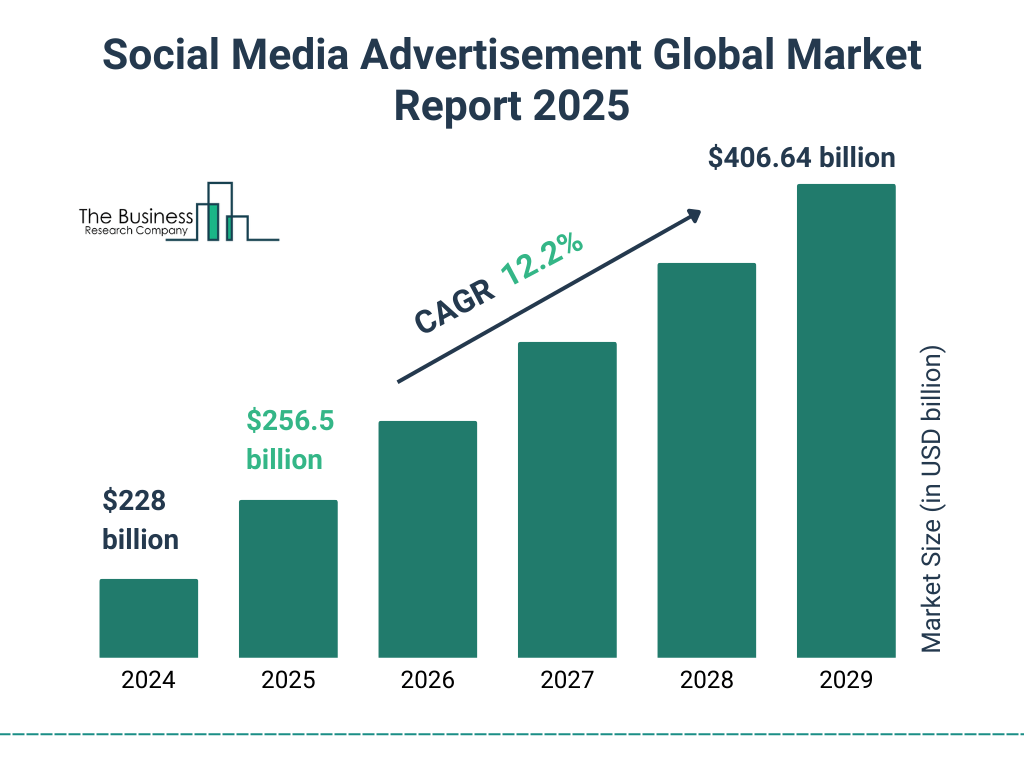
- The social media ad market size is projected to grow from $228 billion in 2024 to $406.64 billion by 2029.
- In 2025, the market is expected to reach $256.5 billion, reflecting strong year-over-year growth.
- The market will expand at a CAGR of 12.2% over the 2024–2029 period.
- By 2026, the market size is forecasted to exceed $280 billion, continuing upward momentum.
- Growth accelerates further in 2027 and 2028, with consistent increases in ad spend leading to the 2029 peak.
Global Social Media Ad Spend Trends
- Global ad spend on social platforms grew 11.6% YoY, climbing from $221.6 billion in 2024 to $247.3 billion in 2025.
- North America contributed nearly 36% of the total global spend in 2025, maintaining its position as the largest regional spender.
- Asia-Pacific ad spend rose to $72.5 billion, marking a 13.2% increase from the previous year.
- Europe saw a slower but steady growth of 8.3%, reaching $49.6 billion in 2025.
- Brands increased budget allocations for reels and short-form videos, now comprising 32% of total social ad investments globally.
- The retail industry led the charge, accounting for 18.7% of all social media ad spend in 2025.
- Political advertising on social platforms is estimated to generate $12 billion globally in 2025, largely due to global elections.
- Dynamic ads, driven by AI personalization, now represent 41% of total social ad spend.
- Small businesses (less than 50 employees) collectively contributed $38.9 billion to global ad spend.
- The average global cost per thousand impressions (CPM) increased to $8.74, up from $7.91 in 2024.
Platform-Wise Advertising Statistics (Facebook, Instagram, TikTok, LinkedIn, X, YouTube)
- Facebook accounted for 38% of global social ad revenue, totaling $94 billion in 2025.
- Instagram’s Stories ads drove a 29% higher click-through rate (CTR) than regular feed ads.
- TikTok users now spend an average of 95 minutes per day on the app, making it a highly lucrative space for video ads.
- LinkedIn’s B2B click-through rates averaged 0.65%, outperforming the industry average for professional networks.
- YouTube Shorts ads drove a 31% increase in ad watch time compared to 2024.
- X (formerly Twitter) saw a 12.4% decrease in total ad revenue, dropping to $3.1 billion, largely due to brand safety concerns.
- Carousel ads on Instagram recorded 1.8x more engagement than single-image posts in early 2025.
- Snapchat ad revenue is projected to hit $6.5 billion in 2025, with strong growth among Gen Z users.
- Pinterest ads achieved a 24% conversion uplift when paired with shopping tools.
- Threads by Meta introduced advertising in late 2024 and is expected to cross $1.3 billion in ad revenue by year-end 2025.
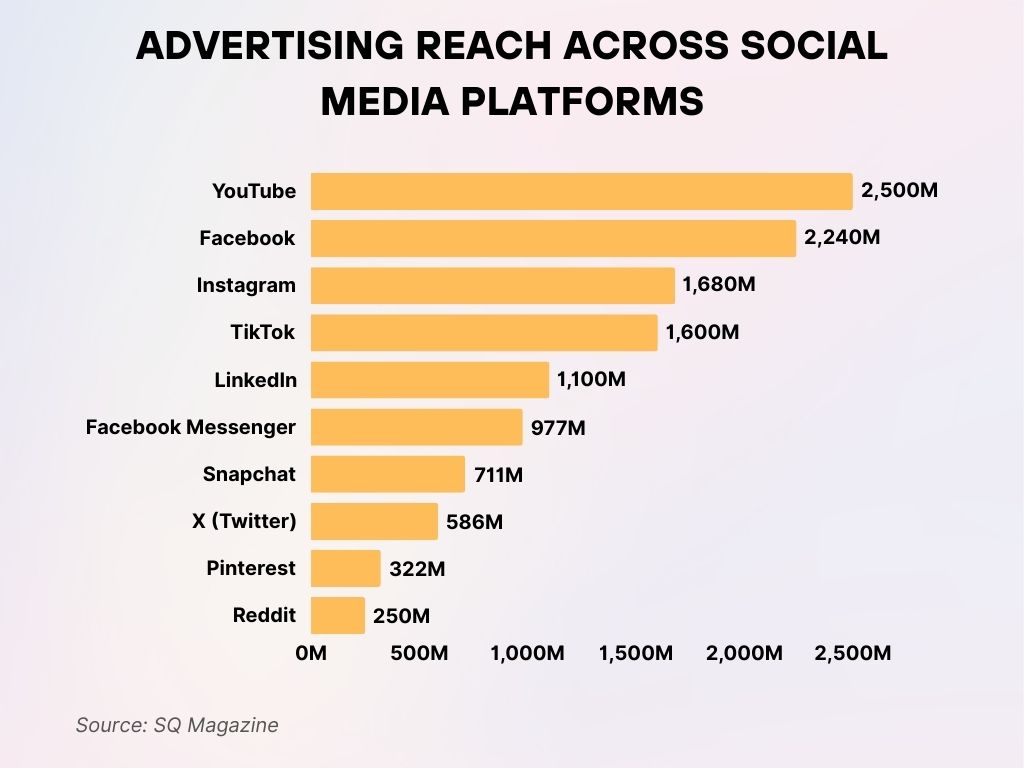
Advertising Reach Across Social Media Platforms
- YouTube leads with a massive 2,500 million potential advertising reach, the highest among all platforms.
- Facebook follows closely with a reported reach of 2,240 million users for advertisers.
- Instagram provides access to 1,680 million users, making it a strong visual ad platform.
- TikTok offers a reach of 1,600 million, showcasing its rapid global growth.
- LinkedIn reaches 1,100 million users, ideal for B2B and professional audience targeting.
- Facebook Messenger delivers ads to approximately 977 million users.
- Snapchat reports a potential reach of 711 million, particularly popular among younger audiences.
- X (Twitter) has a potential advertising reach of 586 million users.
- Pinterest reaches 322 million, valuable for niche lifestyle and shopping content.
- Reddit rounds out the list with 250 million users available for targeted ad campaigns.
Mobile vs Desktop Ad Engagement Rates
- 92.4% of social media ad clicks now come from mobile devices, up from 90.1% in 2024.
- Mobile ad impressions grew by 19% year-over-year, totaling 2.6 trillion impressions globally.
- Desktop ads continue to deliver higher average order values (AOV), $94.31 on desktop vs. $81.07 on mobile.
- Mobile video ads saw a 28% completion rate, compared to 19% for desktop video ads.
- Instagram Reels viewed on mobile generated 3x more interactions than desktop views.
- Mobile users are 1.5x more likely to click on in-feed ads versus sidebar placements.
- Brands using vertical video formats saw a 21% engagement boost on mobile.
- 5G expansion helped reduce video ad load times by 37%, improving overall mobile ad performance.
- Click-through rates (CTR) on mobile rose to 1.34%, surpassing the 1.01% average on desktop.
- App install ads accounted for 18% of mobile ad spend, with gaming apps leading conversions.
Social Media ROI and Conversion Rate Benchmarks
- The average ROI across all social platforms in 2025 reached $5.28 per $1 spent, marking a 7.9% increase from 2024.
- Instagram led in conversion efficiency, delivering an average conversion rate of 1.85%, the highest among all platforms.
- Facebook ad ROI remains strong for e-commerce brands, with a median ROI of 4.6x in Q1 2025.
- LinkedIn ads for B2B services delivered an average cost per lead (CPL) of $42.75, with conversion rates hovering at 6.1%.
- TikTok campaigns showed a conversion rate of 1.34%, up from 1.11% last year, thanks to better targeting and short-form video appeal.
- Advertisers using AI-optimized bidding strategies reported a 14% lift in conversion rates on average.
- YouTube’s TrueView for Action ads saw a 10.5% increase in post-view conversions year-over-year.
- Shoppable posts on Instagram and Facebook increased cart conversions by 22%, particularly among millennial users.
- Pinterest continues to dominate lifestyle brand engagement with a 7.1% CTR on promoted pins.
- Brands investing in cross-platform retargeting campaigns achieved up to 3.3x higher ROI than single-platform strategies.
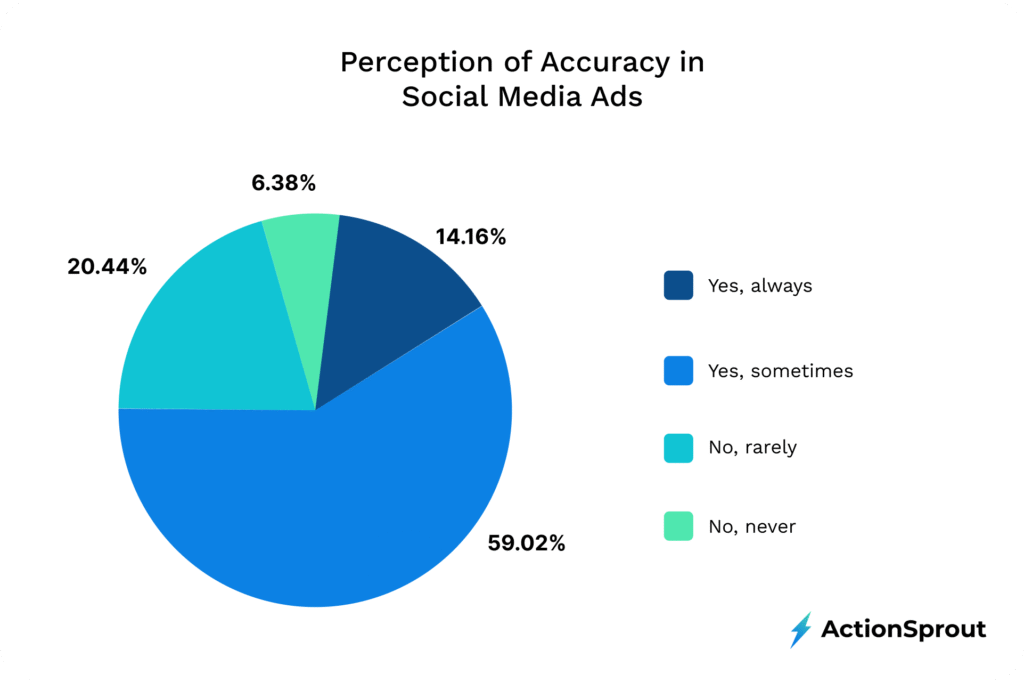
Public Perception of Social Media Ad Accuracy
- 59.02% of users believe social media ads are accurate only sometimes, showing moderate trust in ad content.
- 14.16% say ads are always accurate, reflecting a relatively low level of consistent confidence.
- 20.44% think social ads are rarely accurate, highlighting growing skepticism toward online advertising.
- Just 6.38% believe ads are never accurate, indicating a small but firm group with strong distrust.
Video Ad Performance Across Platforms
- Short-form videos (under 60 seconds) delivered 34% higher engagement rates compared to long-form content in 2025.
- YouTube remains the dominant video ad platform, accounting for 44% of global video ad spend this year.
- Instagram Reels ads achieved a 26% increase in click-through rates versus 2024 figures.
- TikTok’s Spark Ads yielded 17% higher brand recall, particularly among Gen Z audiences.
- Facebook In-Stream video ads now average 85% viewability, a 6% improvement over last year.
- YouTube Shorts outperformed traditional formats for mobile users, seeing 12% higher completion rates in 2025.
- LinkedIn native videos used in thought leadership content generated 1.3x more engagement than link-shared videos.
- Snapchat commercials delivered a swipe-up rate of 2.12%, with AR filters enhancing user interactivity.
- Pinterest Idea Pins incorporating video content led to a 15% uplift in saves and click-through actions.
- Brands using interactive video ads across platforms saw a 32% higher dwell time on average.
Demographics of Social Media Ad Audiences
- Millennials (aged 27–42) still dominate ad engagement, comprising 38% of all paid social clicks in the U.S. market.
- Gen Z (aged 11–26) overtook millennials in video ad interaction, contributing to 42% of TikTok ad engagement in 2025.
- Boomers (aged 59–77) saw a 17% year-over-year increase in Facebook ad response rates.
- Women are 27% more likely than men to engage with lifestyle and e-commerce ads on Instagram and Pinterest.
- B2B decision-makers spend an average of 1.6 hours daily on LinkedIn, a key platform for high-intent leads.
- The fastest-growing ad-responsive demographic in 2025 is men aged 18–24, especially for entertainment and sports content.
- Hispanic audiences in the U.S. represent 21% of all Instagram ad impressions, with high engagement in retail and food ads.
- African American users show above-average ad recall (15% higher) across short-form video platforms.
- Users with household incomes over $100K engage 23% more often with branded YouTube content.
- Urban residents continue to generate 68% of all mobile ad traffic across social platforms.
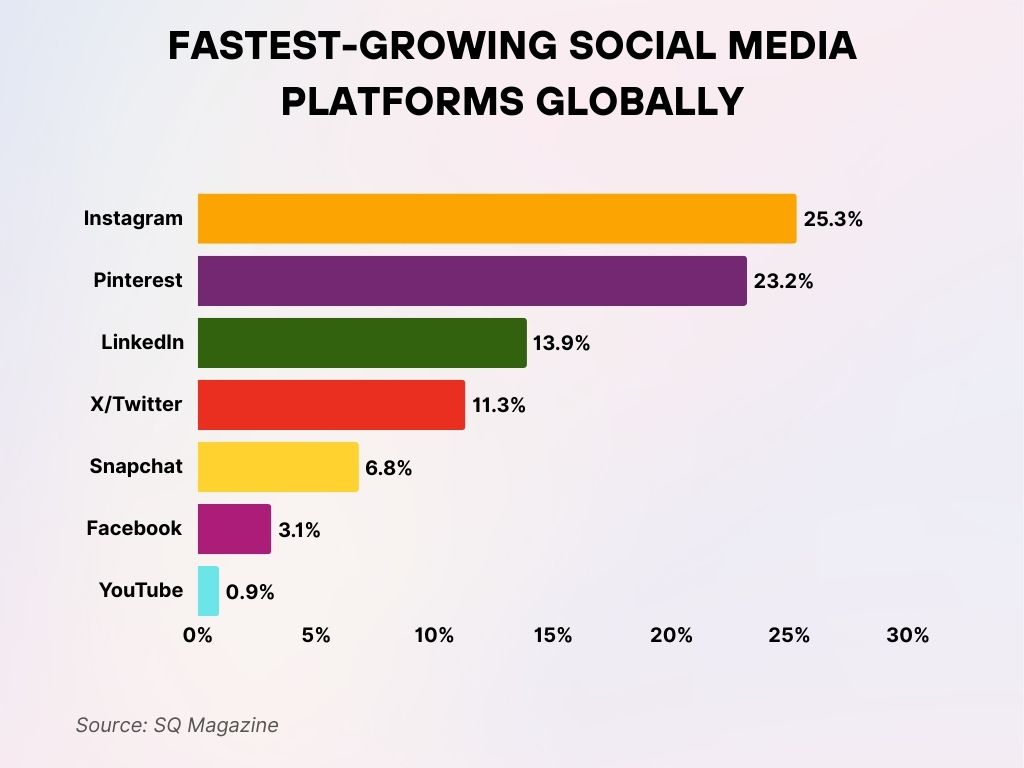
Fastest-Growing Social Media Platforms Globally
- Instagram tops the list with a growth rate of 25.3%, leading global social media expansion.
- Pinterest follows closely with 23.2% growth, driven by interest-based discovery and shopping content.
- LinkedIn shows strong professional growth at 13.9%, reinforcing its value in the B2B space.
- X/Twitter grew by 11.3%, maintaining relevance in real-time news and conversations.
- Snapchat recorded 6.8% growth, particularly among Gen Z users.
- Facebook saw modest growth at 3.1%, indicating market saturation in many regions.
- YouTube had the slowest growth at just 0.9%, despite its vast existing user base.
Cost Per Click (CPC) and Cost Per Thousand Impressions (CPM) Trends
- The average CPC for social ads across all platforms increased to $1.23, compared to $1.09 in 2024.
- Facebook’s CPC remains among the lowest, at $0.94, making it ideal for high-volume awareness campaigns.
- Instagram CPC rose to $1.35, reflecting higher competition in e-commerce and fashion categories.
- LinkedIn ads command a premium, with an average CPC of $5.19, driven by B2B targeting.
- TikTok CPC increased by 18% YoY, now averaging $1.42 across all industries.
- CPM for YouTube video ads hit $12.64, the highest among major platforms, due to long-view duration and prime placements.
- Pinterest CPC is holding steady at $1.12, favored by direct-to-consumer lifestyle brands.
- X (Twitter) saw a CPC decline of 9.3%, now averaging $0.87, partially due to reduced brand participation.
- Brands using automated bidding tools experienced a 7.4% decrease in average CPC across campaigns.
- The CPM benchmark for mobile-only campaigns is $9.01, compared to $6.77 for desktop-only campaigns.
Influencer Marketing Statistics on Social Platforms
- Influencer marketing on Instagram continues to lead, with 69% of marketers favoring it as their top ROI-driving platform in 2025.
- TikTok influencers drove 33% more engagement than traditional brand posts, particularly in beauty and lifestyle segments.
- Nano-influencers (under 10,000 followers) delivered an average engagement rate of 4.3%, outperforming mega-influencers.
- YouTube creators with over 500,000 subscribers generated an average ROI of 6.7x across brand partnerships in 2025.
- LinkedIn influencers, often thought leaders in tech and finance, delivered 2.4x better lead quality in B2B funnels.
- Sponsored content on Snapchat and Instagram Stories saw 49% completion rates, indicating high viewer interest in short-form narratives.
- The average cost of a sponsored TikTok post by a mid-tier influencer (50K–500K followers) rose to $1,150 per post.
- Influencer collaborations with brands on Reels and Shorts resulted in 38% higher reach versus non-partnered content.
- Live-stream influencer marketing, especially on TikTok and YouTube, contributed to $5.6 billion in global revenue.
- 2025 marked a shift toward performance-based contracts, with over 40% of influencer deals tied to sales or conversion metrics.
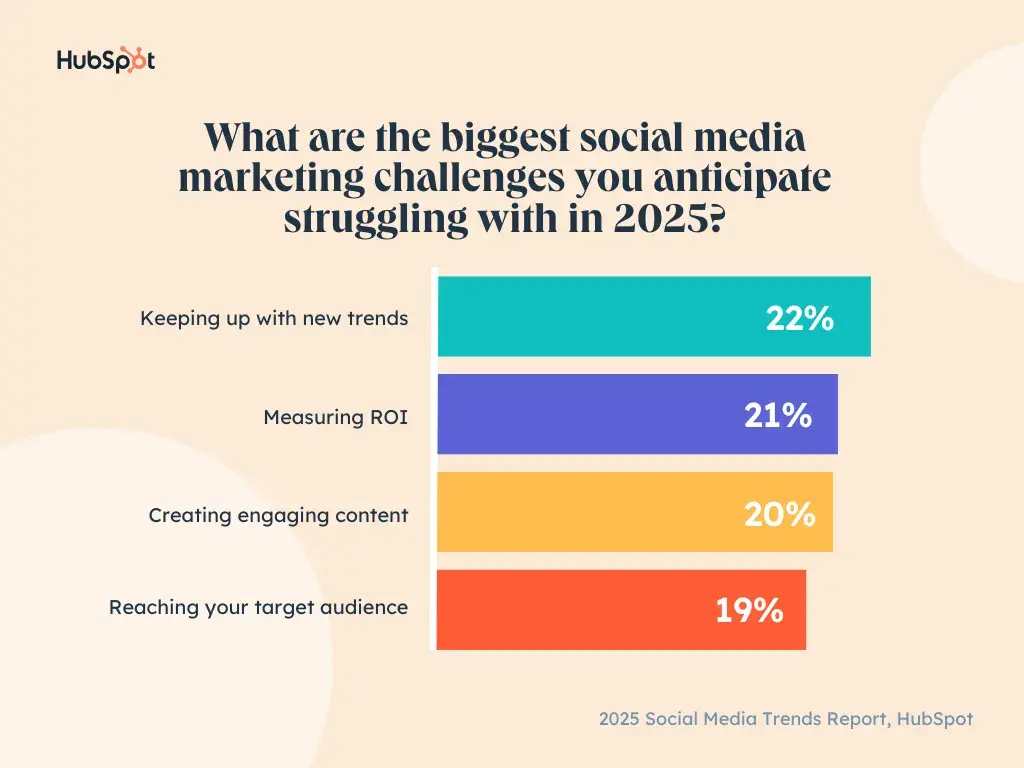
Top Social Media Marketing Challenges
- 22% of marketers anticipate struggling with keeping up with new trends, the most cited challenge for 2025.
- 21% find measuring ROI difficult, highlighting a persistent issue in tracking performance.
- 20% are concerned about creating engaging content that resonates with their audience.
- 19% struggle with reaching their target audience, indicating targeting effectiveness remains a key hurdle.
Industry-Specific Ad Performance (e.g., Retail, Finance, Healthcare)
- Retail brands led social ad spending in 2025, contributing to 18.7% of all social media ad investments globally.
- Healthcare advertisers saw a 21% rise in CTR on educational content, particularly on YouTube and Facebook.
- Finance and fintech companies experienced conversion rates of 5.3% using carousel and video formats on LinkedIn.
- Travel brands returned to pre-pandemic ad levels, with $9.1 billion spent across social channels in 2025.
- Automotive campaigns on Instagram Stories saw a 34% increase in swipe-ups, driven by immersive video tours.
- Education sector advertisers achieved a 3.8x higher engagement rate when using testimonial-based video ads.
- Gaming companies led TikTok’s ad response leaderboard, delivering CTR rates of 7.6% on average.
- B2B tech firms on LinkedIn averaged $7.40 cost-per-lead, the lowest across all professional categories.
- Nonprofits using Meta’s ad grant program reported donation conversions up by 27% year-over-year.
- Luxury fashion ads on Pinterest saw 4.9% higher saves, indicating long-term user intent.
AI and Automation in Social Media Advertising
- 68% of social media advertisers now use AI tools to optimize bidding, audience targeting, and copy generation.
- AI-driven dynamic creative optimization (DCO) boosted ad performance by 23% on average.
- ChatGPT-style AI assistants are now integrated into 42% of brand messaging campaigns on Facebook and Instagram.
- Predictive analytics tools allowed marketers to reduce acquisition costs by 19% in Q1 2025.
- Automated A/B testing increased creative iteration speed by 3.4x, particularly on Meta Ads Manager.
- AI-powered video editing tools helped reduce production costs by 31% for small businesses.
- LinkedIn Campaign Manager added predictive lead scoring in 2025, enhancing B2B ad targeting accuracy.
- Brands using automated retargeting workflows saw a 37% improvement in abandoned cart recovery campaigns.
- AI-generated influencers, or virtual avatars, now account for 2.3% of sponsored content across TikTok and Instagram.
- Voice AI integration in ad experiences, like interactive podcast ads, improved recall by 18% over traditional formats.
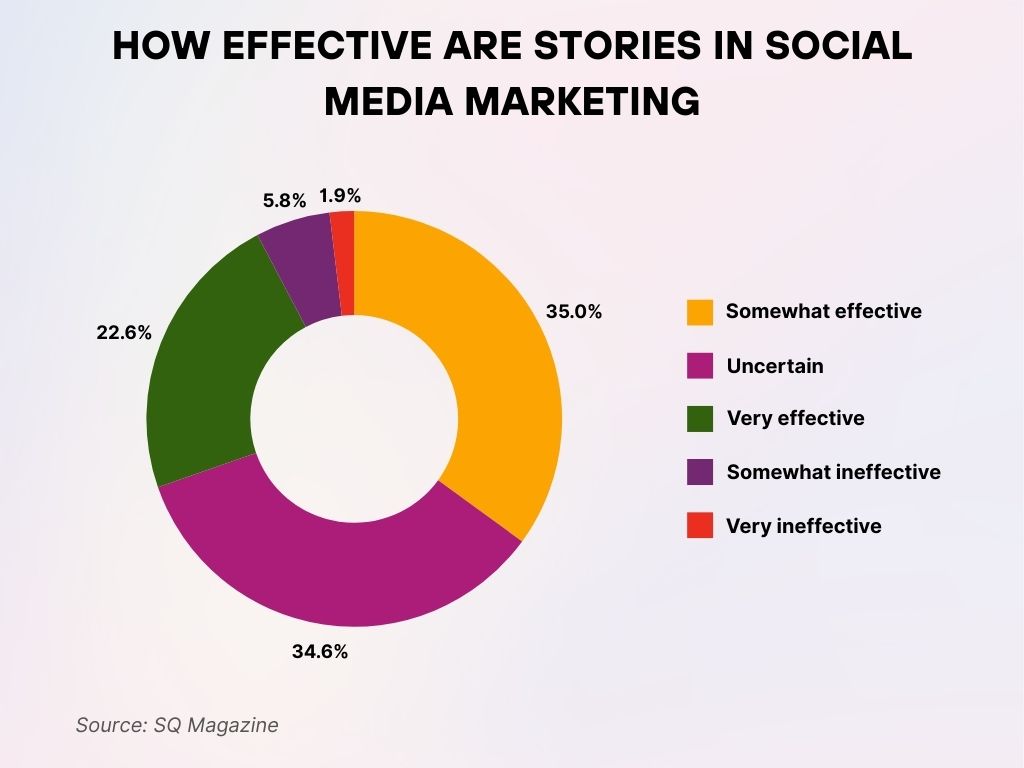
How Effective Are Stories in Social Media Marketing
- 35% of respondents find stories to be somewhat effective for social media marketing campaigns.
- 34.6% are uncertain about the effectiveness of using stories in their strategy.
- 22.6% believe stories are very effective, showing solid confidence in the format.
- 5.8% consider them somewhat ineffective, indicating minor doubts.
- Only 1.9% say stories are very ineffective, reflecting minimal negative sentiment.
Regional and Country-Level Ad Spend Insights
- The United States alone contributed $93 billion to social media ad spend in 2025, making up 37.6% of global investment.
- China ranked second, with a projected spend of $49 billion, fueled by aggressive TikTok (Douyin) and WeChat advertising.
- India’s digital ad market grew by 16.5%, reaching $11.4 billion, with 36% attributed to social platforms.
- Brazil led Latin America with a $7.1 billion social media ad economy, mostly through Instagram and YouTube.
- Germany and the UK each surpassed $6 billion in spend, focusing heavily on mobile-first video formats.
- Australia’s advertisers favored short-form video, contributing to $2.3 billion in social ad spend.
- The Middle East and North Africa (MENA) region’s spend rose by 22%, with Saudi Arabia leading growth.
- South Africa saw the largest YoY percentage increase in Africa, up 31%, led by mobile-first Instagram and TikTok ads.
- Japan’s ad market remained stable, but LinkedIn and YouTube usage for B2B advertising increased notably.
- Southeast Asia, especially Vietnam and Indonesia, saw significant gains with mobile-first campaigns on Facebook and TikTok.
Social Media Ad Fraud and Brand Safety Statistics
- In 2025, $9.8 billion in ad spend was lost globally to social media ad fraud, including fake clicks and bot views.
- Click farms are responsible for an estimated 21% of invalid traffic on lower-tier platforms.
- Facebook and Instagram flagged over 1.3 million ads for violating brand safety standards in Q1 2025.
- AI-based fraud detection tools prevented over $3.2 billion in wasteful spending across major platforms.
- TikTok implemented auto-moderation tools that caught 96% of harmful ad content before publishing.
- Advertisers using pre-bid brand safety filters experienced a 54% lower rate of policy violations.
- YouTube’s brand suitability tools reduced ad placement errors by 38%, enhancing advertiser trust.
- Ad spoofing and impersonation scams accounted for 6.5% of all reported ad fraud incidents.
- Political advertisers were flagged at the highest rate, contributing to 28% of brand safety violations in 2025.
- Blockchain-based ad verification is now in use by 11% of global brands, aiming for transparency and trust.
Recent Developments in Social Media Advertising
- Meta’s Advantage+ Shopping Campaigns now automate targeting and budgeting with 30% better CPA performance.
- YouTube launched Shopping Ads for Shorts, which led to a 41% increase in product click-throughs.
- LinkedIn’s Thought Leader Ads, rolled out in late 2024, now account for 7% of B2B ad budgets.
- Pinterest expanded its AI-powered shopping features, driving double-digit conversion growth in the beauty category.
- Threads by Meta officially opened to advertisers in March 2025, with engagement 1.6x higher than early-stage Instagram.
- Snapchat introduced Sponsored Lenses 2.0, integrating real-time data and AI personalization.
- X announced a revenue-sharing model for advertisers, incentivizing high-performing brands and influencers.
- Meta’s integration with WhatsApp Business now allows shoppable video ads within chat interfaces.
- TikTok partnered with Shopify and BigCommerce, enabling in-app checkout for US merchants in Q2 2025.
- AI-driven creative assistants are now included in most ad managers, allowing real-time performance-based content changes.
Conclusion
As social media advertising enters 2025, one thing is certain: adaptability is the key to success. Platforms are evolving, formats are diversifying, and the rise of automation is rewriting the rules of engagement. Whether you’re a solo entrepreneur or a global CMO, staying informed with the latest data, and letting it shape your decisions, is how you’ll remain relevant in an increasingly competitive space. From ROI benchmarks to fraud prevention, the numbers tell a story of innovation, opportunity, and constant reinvention.


