WHAT WE HAVE ON THIS PAGE
- Editor’s Choice
- Global Google Search Market Share
- Daily Search Queries on Google
- Key Insights into Google Search User Behavior
- Most Popular Search Categories
- Google Usage by Device Type
- Most Used Marketing Channels in 2025
- Google Usage by Region
- Google Search User Demographics
- Google’s Desktop Search Traffic by Country – Snapshot
- Google’s Role in Mobile vs. Desktop Search
- Google Trends and Seasonal Search Behavior
- Unique Keyword Length Trends on Mobile vs. Desktop
- Google Search Usage in Education and Academia
- Google Image, News, and Shopping Search Statistics
- Top Web Traffic Referrers
- Voice Search and AI Integration on Google
- Impact of Google on Online Advertising
- Active Usage of Google Apps by Time Spent (in Minutes)
- Google Chrome’s Influence on Search Behavior
- Google Search Usage in E-commerce
- Privacy Concerns and User Behavior
- Recent Developments in Google Search Technology
- Conclusion
- Sources
It starts with a simple habit: you open your browser and type a question. A few keystrokes later, Google gives you answers, videos, maps, and suggestions before you even finish your thought. For billions of people around the world, this daily interaction is second nature. But behind that blinking cursor is a data powerhouse that shapes how we live, work, shop, and learn.
In this article, we dive deep into Google usage statistics for 2025, exploring what people search for, how they search, and what it tells us about global digital behavior. Whether you’re a marketer, a business owner, or just a curious browser, these numbers offer valuable insight into the world’s most used search engine.
Editor’s Choice
Here are some standout stats you should know before we dive into the full breakdown:
- Google holds 91.65% of the global search engine market share as of Q1 2025.
- Every day, Google processes over 9.1 billion search queries, up from 8.5 billion in 2024.
- 71% of Google searches are conducted on mobile devices, reflecting continued mobile-first behavior.
- The average person uses Google between 3 and 4 times per day, while digital professionals search 20+ times daily.
- The most searched keyword globally in early 2025 is “AI tools”, signaling rising interest in artificial intelligence.

- Over 36% of all Google searches now end without a click – also known as zero-click searches.
- 80% of shoppers begin their product research on Google, making it the top gateway for e-commerce discovery.
Google’s dominance in the search market is nothing short of astonishing. Here’s how it looks in 2025:
- As of March 2025, Google accounts for 91.65% of all search queries globally.
- In the United States, Google commands a market share of 88.9%, slightly down from 89.4% in 2024.
- Bing remains the second-largest player with just 3.21% of the global market.
- In mobile search, specifically, Google controls over 94% of the global share.
- DuckDuckGo held 0.51% of the total market in 2025, catering to privacy-conscious users.
- In India, Google’s market share is slightly higher, sitting at 96.23%.
- European countries show strong loyalty, with countries like Germany and France seeing Google hold over 93% of their local search markets.
- Russia and China remain exceptions, where Yandex and Baidu dominate, respectively.
- Google’s share in Africa has grown by 4.2% YoY, driven by increased mobile adoption.
- Despite rising competition from AI-powered tools, Google remains the undisputed leader in both mobile and desktop search markets.
Daily Search Queries on Google
The volume of queries processed by Google every day offers a clear picture of just how integral the platform is to everyday life:
- As of April 2025, Google handles an estimated 9.1 billion searches per day.
- That translates to roughly 105,000 searches per second, a rise from 99,000 in 2024.
- Annually, Google processes over 3.3 trillion queries worldwide.
- The average user performs 3 to 4 searches daily, while professionals can reach 20–30 queries.
- Peak search times are between 8 AM and 10 AM and again 6 PM to 9 PM.
- Over 15% of the queries Google sees each day are brand new, having never been searched before.
- Voice search queries now represent about 12.4% of all daily searches.
- Google Lens is used over 10 million times daily to perform image-based search tasks.
- Google handles over 1 billion health-related searches every day globally.
- Trending topics can spike search traffic by 300% in just a few hours, showcasing the platform’s real-time relevance.
Key Insights into Google Search User Behavior
- 65% of searchers click on organic results, emphasizing the value of effective SEO strategies.
- 23% of users choose autocomplete suggestions, reflecting a strong reliance on predictive search.
- Only 0.4% of users visit the second page of search results, highlighting the importance of ranking on page one.

Most Popular Search Categories
What people search for reveals a lot about their priorities, needs, and interests. Here are the top categories capturing user attention in 2025:
- News, shopping, and how-to content remain the top three search categories.
- AI and generative tools have climbed into the top 5 most searched categories globally.
- Health-related queries have grown by 14% YoY, particularly around mental health and nutrition.
- Travel searches rebounded in 2025, up 28% from the previous year, as international mobility improved.
- Financial queries related to investments, crypto, and budgeting tools surged by 19%.
- Searches for “near me” services like restaurants or repair shops rose by 11%.
- Career and job-related search interest increased by 8.6%, with hybrid job queries leading the trend.
- Entertainment-related searches—TV shows, movie releases, and celebrity news—remain a top-performing category.
- “How-to” searches still make up over 7% of all queries, indicating users’ trust in Google for guidance.
- Sustainability-related queries (e.g., eco-friendly brands, climate news) have grown by 10.2% YoY.
Google Usage by Device Type
The device people use to access Google search is just as important as the search itself. Here’s a breakdown by device in 2025:
- 71% of all Google searches now come from mobile devices, up from 68% in 2024.
- Desktop usage continues to decline, accounting for just 26% of total Google search traffic.
- Tablets contribute the remaining 3%, used mainly in education and older demographics.
- Among U.S. users aged 18–29, 84% prefer using mobile for Google searches.
- In the B2B sector, 58% of searches still occur on desktops, mostly during working hours.
- Voice-activated device usage (via smartphones and smart speakers) now accounts for over 12% of search volume.
- Google apps (Search, Maps, Chrome) dominate search entry points on Android devices.
- Apple users still favor the Safari + Google Search combo, with 63% of iOS users defaulting to Google.
- Google’s Android OS contributes to over 50% of total mobile searches globally.
- Smart TVs and IoT devices are now contributing marginal search volume but show a 40% YoY growth, driven by voice integration.
Most Used Marketing Channels in 2025
- Only 5% use Other channels, showing a strong preference for mainstream options.
- Social Media is the top marketing channel, used by 82% of marketers.
- 80% of marketers rely on their Website as a key channel.
- Email Marketing remains strong, with 63% usage.
- Content Marketing & SEO are used by 44%, highlighting the value of organic reach.
- Paid Social campaigns are employed by 39% of marketers.
- Search/Display Ads are part of 35% of marketing strategies.
- Events & Tradeshows are still relevant, used by 33%.
- Facebook Messenger is utilized by 25% of consumers, indicating a growing interest in conversational marketing.
- Customer Communities/User Groups are tapped into by 20% of marketers.
- WhatsApp marketing is gaining traction with 18% usage.

Google Usage by Region
Google’s global footprint is as diverse as the users who rely on it. Regional usage trends highlight how geography, infrastructure, and culture influence search behavior:
- In North America, Google’s market penetration stands at 92.1%, with the U.S. leading in daily query volume per user.
- Latin America saw a 6.3% YoY increase in Google search activity, driven by mobile-first users and expanding internet access.
- Europe maintains strong usage with countries like the UK, Germany, and France showing over 93% search share.
- In Asia-Pacific, particularly India and Indonesia, Google usage continues to skyrocket. India now logs over 1.5 billion queries per day.
- Africa is emerging as a growth engine for Google, with a 23% rise in search volume driven by affordable smartphones and mobile plans.
- In China, Google usage remains restricted, but in neighboring regions like Hong Kong and Taiwan, adoption exceeds 90%.
- The Middle East shows significant Google usage among younger users, with over 70% of Gen Z using it as their primary discovery tool.
- In Australia, Google holds a consistent 94.7% search engine market share, one of the highest globally.
- South Korea remains a competitive market due to strong local players, but Google still commands 71% of desktop searches.
- In emerging Southeast Asian markets, such as Vietnam and the Philippines, Google is gaining up to 15% YoY growth in search queries.
Google Search User Demographics
Understanding who uses Google tells us a lot about the future of search. In 2025, demographic insights reveal a rich mix of age, gender, and habits:
- Millennials and Gen Z make up 63% of total Google users worldwide.
- In the U.S., 89% of adults use Google at least once per week.
- Among teenagers (13–19), 95% use it as their main information source for homework and trending topics.
- Females account for 51% of Google’s daily search traffic globally.
- Urban users perform 21% more searches per day than rural users, often on mobile.
- Professionals in tech, marketing, and academia average 22–28 searches per day, compared to the general population’s 3–5.
- Seniors (65+) now represent 14% of all U.S. Google users, up from 11% in 2023.
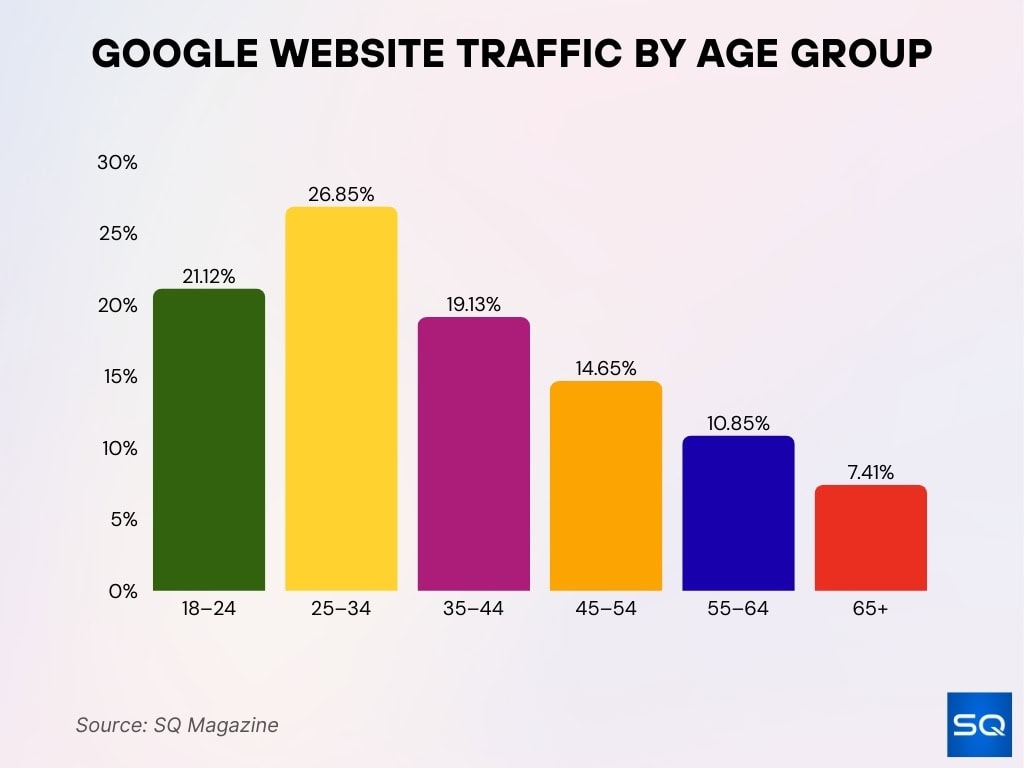
- Users aged 25–34 are the most active demographic, contributing to 27% of total searches.
- Education levels influence search depth: college-educated users spend 38% more time analyzing search results.
- Globally, non-English queries now make up more than 52% of all searches, showing Google’s strong international footprint.
Google’s Desktop Search Traffic by Country – Snapshot
- China: Google accounts for only 8.78% of desktop searches. Strict regulations and homegrown platforms like Baidu dominate the market.
- India: Google captures 93.99% of desktop search traffic. It holds the strongest dominance among all countries analyzed.
- Brazil: Google accounts for 89.11% of desktop searches. The platform remains the go-to search engine for most users in the country.
- Italy: With an 88.54% share, Italy heavily relies on Google for search queries. This reflects deep user trust in the platform.
- Spain: Google controls 86.41% of the desktop search market. Its presence remains consistent across Southern Europe.
- Hong Kong: At 86.19%, Google dominates desktop searches. Local users favor its ecosystem over regional alternatives.
- Australia: Google owns 86.17% of desktop search traffic. Its market leadership remains strong across Oceania.
- Canada: Google secures 83.66% of desktop search usage. This reflects its popularity among North American users beyond the U.S.
- United Kingdom: Holding 82.35% of the market, Google is the preferred search engine. UK users consistently show loyalty to the platform.
- France: Google sees 80.95% of desktop search activity. Despite local alternatives, it remains the dominant choice.
- Germany: With 80.63% usage, Google maintains a stronghold. The German market is largely aligned with broader EU trends.
- United States: Google has 75.78% of the desktop search share. While still dominant, it faces more competition than in other countries.
- Japan: Google holds 71.67% of the search traffic. The platform remains popular despite strong local alternatives.
- South Korea: At 71.4%, Google sees solid adoption. However, regional platforms like Naver still pose notable competition.
- Russia: Google’s share drops to 41.67%. Yandex remains a major competitor in the local search space.

Google’s Role in Mobile vs. Desktop Search
The shift to mobile is no longer a trend—it’s the norm. Here’s how the split looks in 2025:
- 71% of Google searches are now mobile, while desktop makes up just 26% and tablet 3%.
- Mobile-first indexing is now fully standard across Google’s algorithms.
- On average, mobile users spend 32% less time per search, favoring quick, transactional queries.
- Voice search is more common on mobile, with 80% of voice queries occurring via smartphone.
- Desktop usage remains strong for work-related searches, with higher use during office hours (9 AM to 5 PM).
- Mobile bounce rates on Google SERPs are 27% higher than desktop, emphasizing the need for responsive content.
- Mobile users are 3x more likely to use location-based queries like “near me” or “open now.”
- Desktop users tend to click more links, visiting 2.1x more pages per session than mobile users.
- Google’s AMP (Accelerated Mobile Pages) format remains essential, improving mobile load speed by up to 85%.
- Shopping and navigation are the top mobile use cases, while desktop sees more research-heavy and academic queries.
Google Trends and Seasonal Search Behavior
Google Trends shows us how user interest shifts based on seasons, events, and societal trends. These patterns are invaluable for businesses and researchers alike:
- Holiday shopping searches peak between November 15 and December 20, with a spike in “best gift” queries.
- During the tax season (January–April in the U.S.), searches for “how to file taxes” grow by 240%.
- In summer, searches related to “travel,” “beach gear,” and “outdoor recipes” increase by over 300% globally.
- Election years drive massive surges in political search terms—2024 saw a 400% increase in queries like “how to vote” or “ballot tracker.”
- During flu season, health-related searches such as “cold vs. flu” see a 230% spike.
- January remains the top month for “fitness” and “gym memberships” queries.
- Google Trends data shows that real-time events (celebrity deaths, global crises) can push specific terms into the top 10 in just 15 minutes.
- “New AI tools” and “ChatGPT alternatives” are among the most searched terms in tech during Q1 2025.
- Interest in “eco-friendly products” peaks around Earth Day (April 22), showing a 70% search boost.
- Back-to-school season (late August) drives sharp increases in searches for “school supplies,” “homework help,” and “student laptops.”
Unique Keyword Length Trends on Mobile vs. Desktop
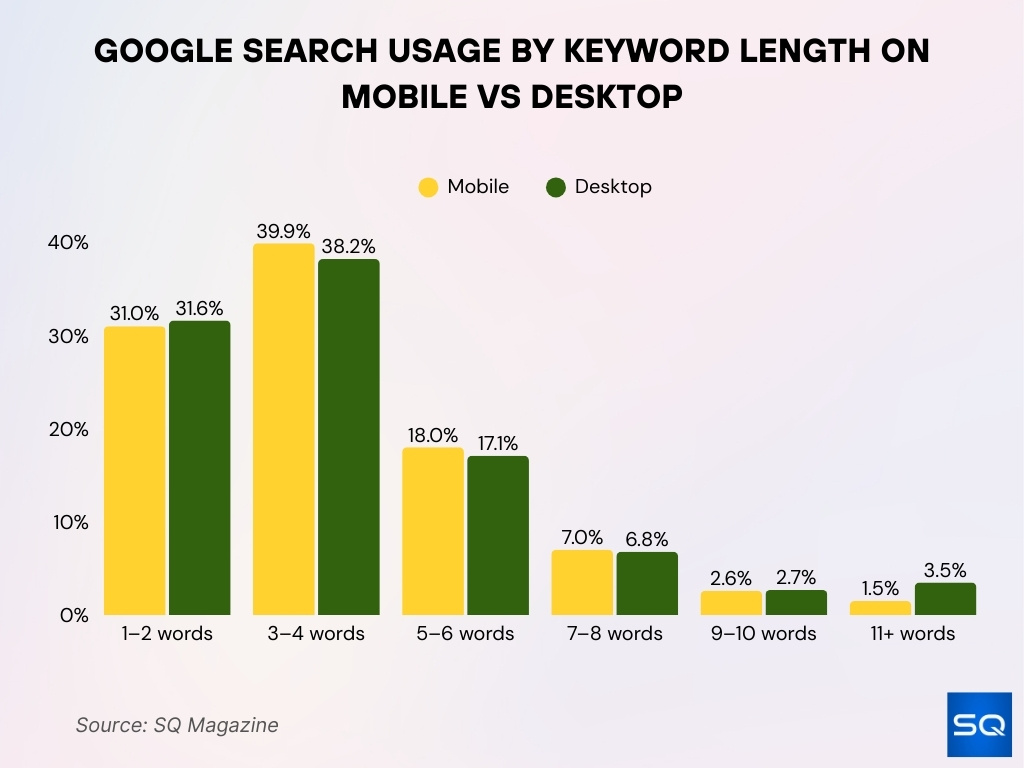
- Very long keywords (11+ words) are rare on mobile (1.5%) but more common on desktop (3.5%), likely due to the ease of typing on larger devices.
- Short keywords (1–2 words) make up 31% of mobile and 31.6% of desktop searches, showing near-equal preference for brief queries.
- 3–4 word keywords are the most common, with 39.9% on mobile and 38.2% on desktop—highlighting user tendency toward slightly longer, more descriptive phrases.
- Mid-length keywords (5–6 words) account for 18% of mobile and 17.1% of desktop searches, which is still significant for a long-tail strategy.
- 7–8 word phrases are used in 7% of mobile and 6.8% of desktop queries, showing a slight drop in usage as keyword length increases.
- Long-tail keywords (9–10 words) have a small share: 2.6% mobile and 2.7% desktop.

Google Search Usage in Education and Academia
Google isn’t just for casual queries—it’s a central tool for learning and research at all levels of education:
- Over 65% of students globally use Google to assist with assignments and projects.
- In the U.S., 78% of K–12 teachers integrate Google tools (Search, Classroom, Docs) into their lessons.
- Google Scholar receives over 160 million visits per month, solidifying its role in academic research.
- Queries related to “homework help” and “study tips” peak between 4 PM and 10 PM daily.
- College students are 2.3x more likely to use Google for sourcing journal articles than traditional databases.
- Queries for “best colleges” and “how to apply for FAFSA” peak between September and January.
- Searches for online courses rose 18% YoY in 2025, with major spikes in AI and coding topics.
- Google Translate is used by 32% of multilingual students, especially in higher education.
- Students searching for “how to write a thesis” increased by 9.6% compared to last year.
- Google Docs and Drive are the most commonly searched productivity tools for students, showing over 12 million daily active users in education contexts.
Google Image, News, and Shopping Search Statistics
Beyond the main Search tab, users increasingly engage with specialized formats to find images, headlines, and products faster:
- Google Images is the second most used Google service, with over 1.1 billion image searches daily.
- Image search usage is highest in fashion, home decor, and food-related content.
- Google News receives more than 150 million visits per day, particularly during breaking news cycles.
- The “Top Stories” carousel in search results captures 35–40% of initial clicks for news queries.
- Google Shopping sees over 900 million product search queries daily, especially during sales seasons.
- 70% of shoppers say they discover new brands through Google Shopping before visiting an online store.
- Mobile shopping searches that include the word “best” have grown by 34% YoY.
- Google Lens now contributes to over 30% of visual search-related product discoveries.
- “Compare prices” searches on Google Shopping rose by 22% in Q1 2025.
- Local inventory ads displayed via Google Shopping have increased click-through rates by 31%, connecting users with nearby physical stores.
Top Web Traffic Referrers
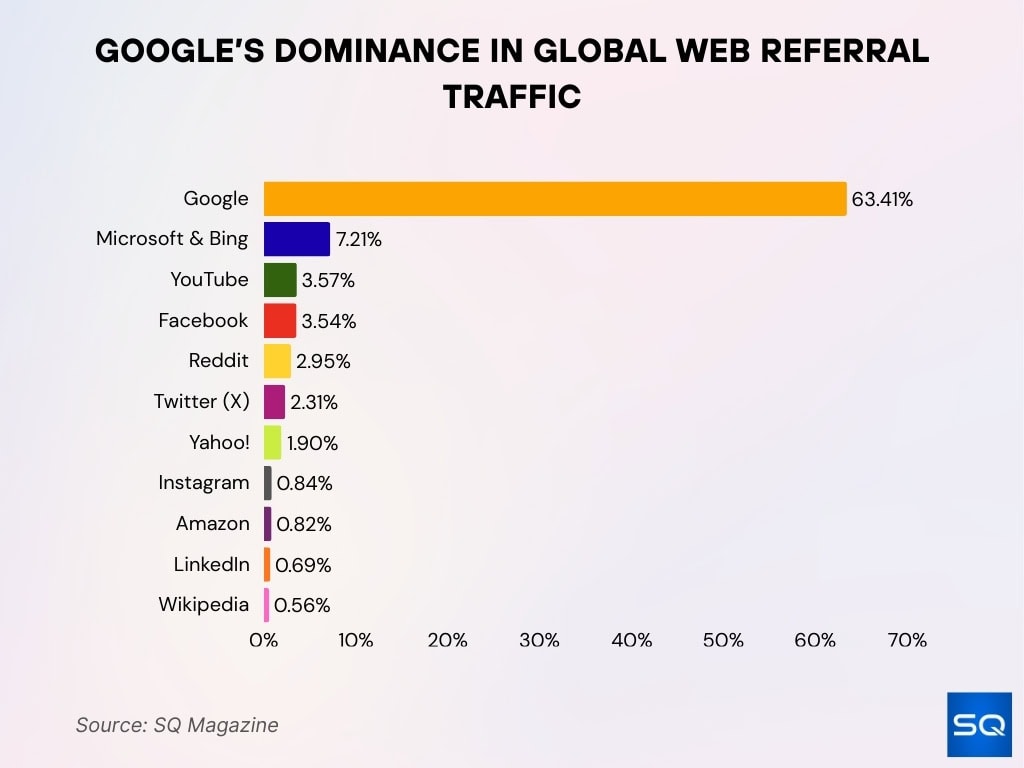
- The Next 155 sites combined make up 10.34%, showing the long tail of diversified traffic sources.
- Google dominates with a staggering 63.41% of all referral traffic across the web.
- Microsoft & Bing come in second with 7.21%, showing a notable presence despite Google’s lead.
- YouTube contributes 3.57% of referral traffic, making it the top video-based source.
- Facebook drives 3.54% of traffic, remaining a powerful social referral channel.
- Reddit generates 2.95%, emphasizing its growing influence as a discovery platform.
- Twitter (X) accounts for 2.31%, still relevant despite shifting usage patterns.
- Yahoo! sends 1.90%, maintaining a modest role in search and content referrals.
- Instagram contributes 0.84%, lower than Facebook and Reddit despite high user engagement.
- Amazon accounts for 0.82%, mostly through product and affiliate links.
- LinkedIn drives 0.69%, reflecting B2B engagement and content sharing.
- Wikipedia sends 0.56% of traffic, largely from informational content.

Voice Search and AI Integration on Google
As AI becomes more embedded in daily digital habits, voice search and smart tools are transforming how users interact with Google:
- Over 28% of U.S. adults now use voice search on Google at least once per week.
- Globally, 12.4% of all Google queries are now voice-activated, up from 10.7% in 2024.
- 40% of Gen Z users prefer speaking to Google over typing, especially via mobile devices and smart assistants.
- Google Assistant processes over 1 billion voice commands monthly, with the top queries being “weather,” “reminders,” and “play music.”
- AI-generated results (via Search Generative Experience – SGE) now appear in 17% of desktop queries and 13% of mobile queries.
- Google’s AI snippets reduce user bounce rates by 22%, as they often answer questions before the first click.
- Conversational queries (long-form voice searches) have increased by 14% YoY, driven by natural language improvements in AI.
- Google Lens, powered by AI, has seen a 35% YoY growth in daily usage for text extraction and product discovery.
- Google’s new Gemini integration offers personalized search enhancements, expected to roll out to 500 million+ users by end of 2025.
- AI-assisted search results have 25% higher click-through rates, especially in categories like tech, health, and travel.
Impact of Google on Online Advertising
Google doesn’t just answer questions—it’s the backbone of modern digital advertising. Its ad tools dominate global ad spending:
- Google Ads accounted for 28.3% of all global digital ad spending in 2024, valued at over $258 billion.
- In the U.S., 62% of businesses allocate a majority of their ad budget to Google platforms (Search + Display).
- The average Google Ad has a conversion rate of 4.4%, outperforming Facebook and Twitter.
- Over 1.3 million small businesses in the U.S. rely on Google Ads to drive web traffic.
- The cost-per-click (CPC) on Google Search rose to an average of $2.58 in Q1 2025.
- 70% of marketers say Google Ads delivers the best ROI among all ad platforms.
- Local Services Ads (LSAs) saw a 19% increase in usage YoY, especially among trades and legal sectors.
- Product Listing Ads (PLAs) on Google Shopping drive 76% of retail ad clicks.
- Google’s AI-enhanced bidding strategies improve ROI by up to 32%, according to internal advertiser reports.
- YouTube, owned by Google, contributes to over 16% of total Google ad revenue, primarily through pre-roll and display ads.
Active Usage of Google Apps by Time Spent (in Minutes)
- Google Forms is included in the chart, but its specific usage percentage isn’t labeled, likely accounting for the remaining 0.7–1%.
- Google Docs leads by far with 58.9% of total active usage time, highlighting its dominance in document collaboration.
- Google Slides accounts for 15%, showing strong use for presentations in educational or professional settings.
- Google Sheets follows with 13%, reflecting widespread use for data management and analysis.
- Google Classroom makes up 6.3%, supporting its role as a centralized platform for learning management.
- Google Drive sees 6.1% of total usage, largely for storage and file access across devices.

Google Chrome’s Influence on Search Behavior
The browser people use affects how they search—and Google Chrome is deeply tied to search volume and behavior:
- Google Chrome holds 64.3% of the global browser market share as of April 2025.
- Over 5.1 billion devices worldwide have Chrome installed.
- Chrome users conduct 19% more searches per session than users on Firefox or Safari.
- Preloading Google as the default search engine boosts search frequency by up to 26%.
- Google Discover, integrated with Chrome mobile, contributes to over 5 billion article impressions daily.
- Chrome’s “autocomplete” and “top sites” features influence 12–15% of click-through behavior.
- 87% of Android users use Chrome exclusively for browsing.
- Chrome’s real-time URL suggestions are responsible for more than 20% of navigational searches.
- Sync across devices (desktop to mobile) increases user retention by 18%.
- Google uses Chrome browsing data (opt-in only) to fine-tune its algorithmic understanding of user behavior.
Google Search Usage in E-commerce
Search plays a crucial role in how consumers discover, compare, and purchase products:
- 80% of online product journeys begin with a Google search.
- In 2025, over 1.4 billion product-related queries were made daily on Google.
- Mobile e-commerce searches grew by 21% YoY, showing rising on-the-go shopping behavior.
- Searches containing “best [product] under $50” rose by 42%, indicating budget-conscious browsing.
- 61% of shoppers say they trust Google search results more than online store reviews.
- Google Shopping ads now deliver an average ROAS (return on ad spend) of 5.1x for retailers.
- 45% of users click Google search results over Amazon when researching a product.
- In the apparel category, image-based search (via Google Lens) grew 38% YoY.
- “Buy now, pay later” searches increased 19% from last year, reflecting evolving consumer finance habits.
- Google’s “In Stock Near You” feature influenced 13% of offline purchases in the U.S.
Privacy Concerns and User Behavior
With all this search activity, user privacy is a growing topic—especially in how Google collects, stores, and uses data:
- 72% of U.S. users are concerned about how Google tracks their search behavior.
- Despite privacy concerns, only 14% of users regularly use incognito or private search modes.
- 35% of users have adjusted their ad personalization settings in their Google account within the past year.
- Google processes over 20 petabytes of data daily, raising scrutiny from privacy advocates.
- In 2025, searches for “how to delete Google history” increased by 47% compared to 2024.
- Google rolled out auto-delete features for activity history, set to 18 months by default.
- The EU fined Google €2.4 billion for non-compliance with consent rules under the GDPR framework.
- Google’s Privacy Sandbox, designed to phase out third-party cookies, is now active on over 60% of Chrome browsers.
- Over 18% of users have started using privacy-focused alternatives like DuckDuckGo, though Google still dominates.
- Google continues to emphasize transparency dashboards, helping users monitor what data is being collected and why.
Recent Developments in Google Search Technology
Google continues to innovate at a rapid pace, evolving how it understands, processes, and delivers search results:
- In early 2025, Google rolled out Search Generative Experience (SGE) in over 100 countries, enhancing AI-generated summaries.
- Multimodal search now allows users to search using a combination of text + images + voice, powered by Gemini.
- Google’s MUM (Multitask Unified Model) technology can understand 75+ languages, enabling richer cross-language search.
- The “Perspectives” tab is now active on most queries, showcasing first-person sources and forums to reduce misinformation.
- Passage-based indexing improved by 18%, letting Google surface highly relevant sections within long content.
- Google Maps search is more integrated with main SERPs, accounting for 20% of local query results.
- New contextual result filtering lets users refine their results by tone (e.g., blog post vs. news), improving accuracy.
- Google is testing AI avatars to answer queries via voice + video in select markets.
- “What to watch” and “Things to do” cards are now triggered by 18% of mobile entertainment and travel searches.
- The speed of core updates increased in 2025, with 5 major updates released in the first four months alone.
Conclusion
Google is far more than a search engine. It’s a behavioral mirror, a digital compass, and a commercial gateway. As of 2025, it processes over 3.3 trillion searches annually, helping users navigate everything from trivial curiosities to life-changing decisions. Whether it’s through traditional text queries, voice commands, or AI-driven summaries, Google is continuously reshaping the way we interact with information.
Understanding how people use Google—across devices, regions, and intentions—is essential for anyone working in tech, marketing, education, or beyond. As search continues to evolve, staying informed means staying relevant.
Sources
- https://explodingtopics.com/blog/google-searches-per-day
- https://seo.ai/blog/how-many-people-use-google
- https://www.statista.com/statistics/216573/worldwide-market-share-of-search-engines/
- https://www.businessdasher.com/search-engine-statistics/
- https://growtha.com/blog/google-search-engine-usage-statistics
- https://thesocialshepherd.com/blog/google-analytics-statistics
- https://vpnalert.com/resources/google-statistics/
- https://quickcreator.io/seo/google-search-statistics-daily-yearly-trends/
ABOUT AUTHOR