It started as a quiet revolution. In 2005, Google acquired Urchin and rebranded it into what we now know as Google Analytics, a free tool that changed the way websites measured success. Fast forward today, and analytics isn’t just for webmasters or SEO nerds anymore. It’s the foundation of digital strategy, guiding everything from e-commerce optimizations to government communication efforts.
Whether you’re a small business or a Fortune 500 company, the numbers you see in your Google Analytics dashboard can determine where your next dollar goes. With the full migration to GA4 now complete, this year’s statistics reveal the real impact of the platform in a data-driven world.
Editor’s Choice
- 51.04% of the top 1 million websites globally now use Google Analytics for traffic and performance tracking.
- GA4 is implemented on 33.65% of the top 1 million websites by traffic, reflecting rapid enterprise adoption.
- Over 14.2 million websites worldwide currently run GA4 for analytics.
- Around 3.2 million U.S. websites have already adopted GA4 as their primary analytics solution.
- Google Analytics holds roughly 43% global market share among web analytics platforms.
- GA4 is used by 43.35% of the highest‑ranking 10,000 websites worldwide.
- 42.23% of the top 100,000 most‑visited websites rely on Google Analytics.
Recent Developments
- On January 16, GA4 introduced cross-channel budgeting (beta) to forecast performance and allocate spend across channels from a single budgeting workspace.
- October updates added benchmarking support for 20 additional unnormalized metrics, including “New users” and “Total revenue.”.
- Report snapshot templates now include dedicated layouts for User behavior, Sales and revenue, and Marketing performance cards.
- Aggregate identifiers were rolled into GA attribution to improve accuracy for paid Google Ads traffic across reports.
- GA4 predictive audiences were rolled out broadly, enabling purchase‑probability audiences that drove 34–42% higher conversion rates for early adopters.
- New consent hub and Google Tag Diagnostics features surfaced consent issues directly in GA4, improving user tracking by nearly 7% in tests.
Google Analytics Adoption by Industry
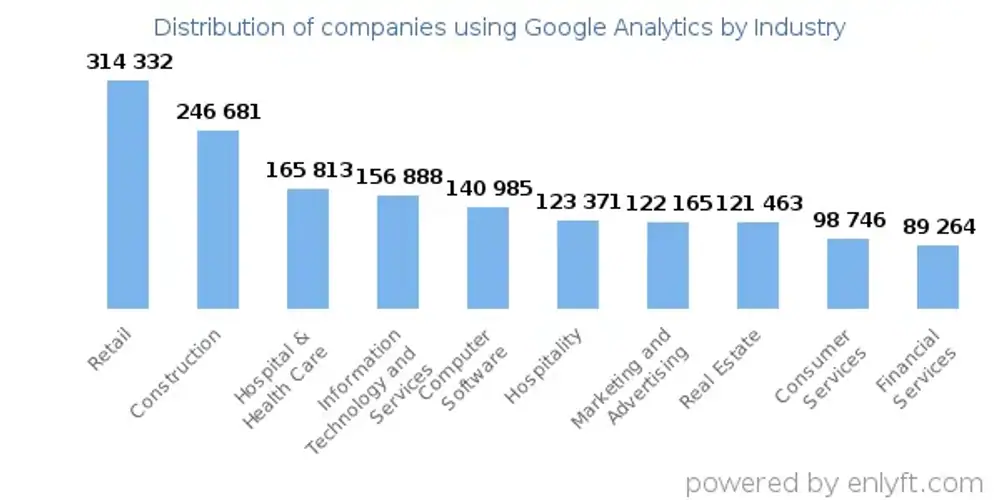
- Retail leads adoption, with 314,332 companies using Google Analytics, highlighting its role in tracking customer behavior and conversion performance.
- Construction ranks second at 246,681 companies, reflecting strong use of analytics for lead generation and regional demand analysis.
- Hospital and Health Care reports 165,813 users, showing increased reliance on digital metrics for patient engagement and service optimization.
- Information Technology and Services follows with 156,888 companies, reinforcing analytics as a core tool for product usage and marketing efficiency tracking.
- Computer Software firms total of 140,985 users, underlining the importance of analytics in user acquisition and retention analysis.
- Hospitality records 123,371 companies, where analytics supports booking behavior analysis and demand forecasting.
- Marketing and Advertising shows 122,165 adopters, reflecting heavy dependence on campaign performance and attribution measurement.
- Real Estate adoption reaches 121,463 companies, driven by the need to track listing views and inquiry sources.
- Consumer Services includes 98,746 companies, using analytics to measure service demand and conversion paths.
- Financial Services trails with 89,264 companies, indicating comparatively lower adoption across regulated financial sectors.
Average Frequency of Google Analytics Usage by Businesses
- 88% of marketers use analytics and measurement tools in their work, underscoring near‑daily reliance on platforms like Google Analytics for decision-making.
- 65% of organizations are expected to make fully data-driven decisions, driven by continuous analytics usage across departments.
- Businesses using real-time data analytics report revenue growth in 80% of cases, highlighting always-on dashboard usage.
- Companies leveraging customer data analytics platforms experience over 9x greater annual growth, indicating frequent, embedded analytics use.
- Marketing teams are using 230% more data compared to 2020, with a 50% increase in average query counts for marketing data.
- Only 14% of marketers cite a lack of data expertise as a blocker, suggesting most teams actively access analytics multiple times per week.
- 56% of marketers say they do not have enough time to properly analyze their data, reflecting a very high frequency of analytics access.
- 88% of marketers use AI daily, often in combination with analytics platforms for faster insights and reporting.
Market Share of Google Analytics Among Web Analytics Tools
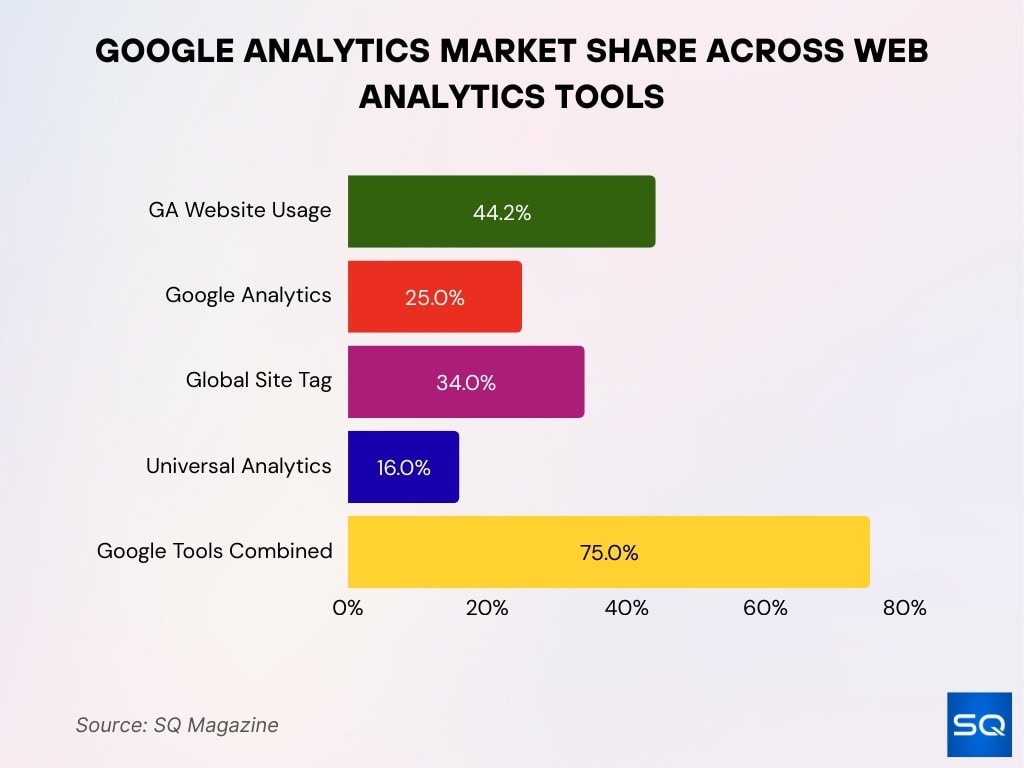
- Google’s three analytics tools collectively control over 75% of the global web analytics software market by technology share.
- Google Analytics alone holds approximately 25% worldwide market share among web analytics technologies.
- Google Global Site Tag leads with a market share of over 34%, ahead of other analytics tagging solutions.
- Google Universal Analytics still accounts for roughly 16% of the global web analytics technology market.
- Across all tracked websites, Google Analytics is used by 44.2% of sites using any traffic analysis tool.
Benefits and Limitations
- Businesses that follow structured GA4 implementation frameworks report 34% higher marketing ROI and 28% lower customer acquisition costs within 90 days.
- Companies using GA4’s predictive and AI-driven insights achieve 20–30% improvements in media efficiency from budget optimization recommendations.
- Early adopters that deeply leverage GA4 data for experimentation see 4.3x higher conversion rates in high‑intent segments versus the 8% baseline.
- Only 37% of businesses trust their analytics data enough to use it for major strategic decisions, underscoring ongoing confidence gaps.
- Leading firms using GA4 for actionable insights report 34% marketing ROI improvement tied directly to better attribution and audience targeting.
- A lack of clear GA4 training and onboarding continues to leave many teams struggling with configuration complexity and data discrepancies, affecting over 60% of implementations.
- Consent-related data loss in GA4 can reach up to 70% of visitors when opt‑in rates are low, forcing reliance on modeled data for reporting.
Google Analytics Adoption by Company Size
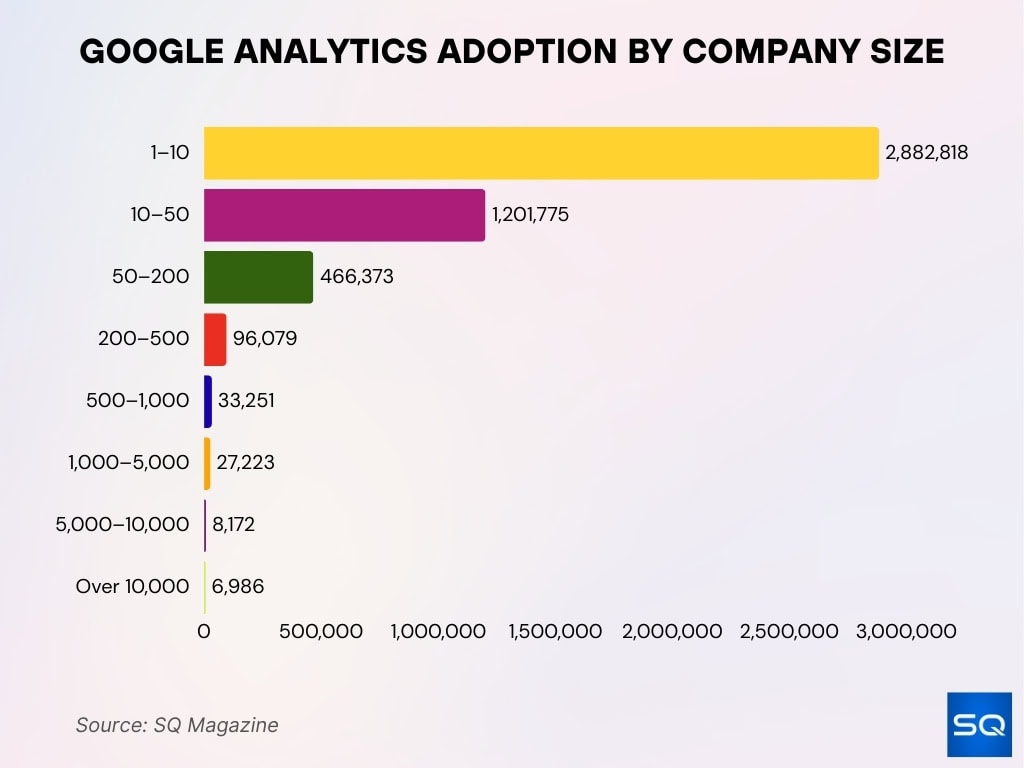
- Small businesses dominate usage, with 2,882,818 companies in the 1–10 employee range actively using Google Analytics.
- Companies with 10–50 employees account for 1,201,775 users, showing strong adoption among growing startups and early-stage firms.
- Mid-sized organizations with 50–200 employees include 466,373 companies, reflecting analytics use for structured marketing and performance tracking.
- Adoption drops among larger SMEs, with 96,079 companies in the 200–500 employee category.
- Firms employing 500–1,000 people total 33,251, indicating more selective usage as analytics stacks become more complex.
- Large enterprises with 1,000–5,000 employees include 27,223 companies using Google Analytics.
- Very large organizations in the 5,000–10,000 employee range account for 8,172 users.
- The largest enterprises, with over 10,000 employees, show the lowest adoption at 6,986 companies, often due to reliance on custom or enterprise analytics platforms.
Google Analytics Integrations
- Linking Google Analytics with Google Ads is correlated with a 23% increase in conversions and a 10% reduction in cost per conversion.
- Google Tag Manager is used by 48.1% of all websites, reflecting deep integration with Google Analytics implementations.
- Google Tag Manager holds around 95% market share in the tag management industry among websites using a tag manager.
- There are 34,710,321 websites using Google Tag Manager, including 32,887,374 live sites and 1,822,947 redirects.
- Of all Google Tag Manager sites, 14,680,937 are located in the United States, making it the leading GTM market.
- Standard GA4 properties exporting to BigQuery have a daily BigQuery Export limit of 1 million events for batch exports.
- Properties exceeding the 1 million daily event export limit can have their BigQuery exports automatically paused until volumes are reduced.
Top Countries Using Google Analytics
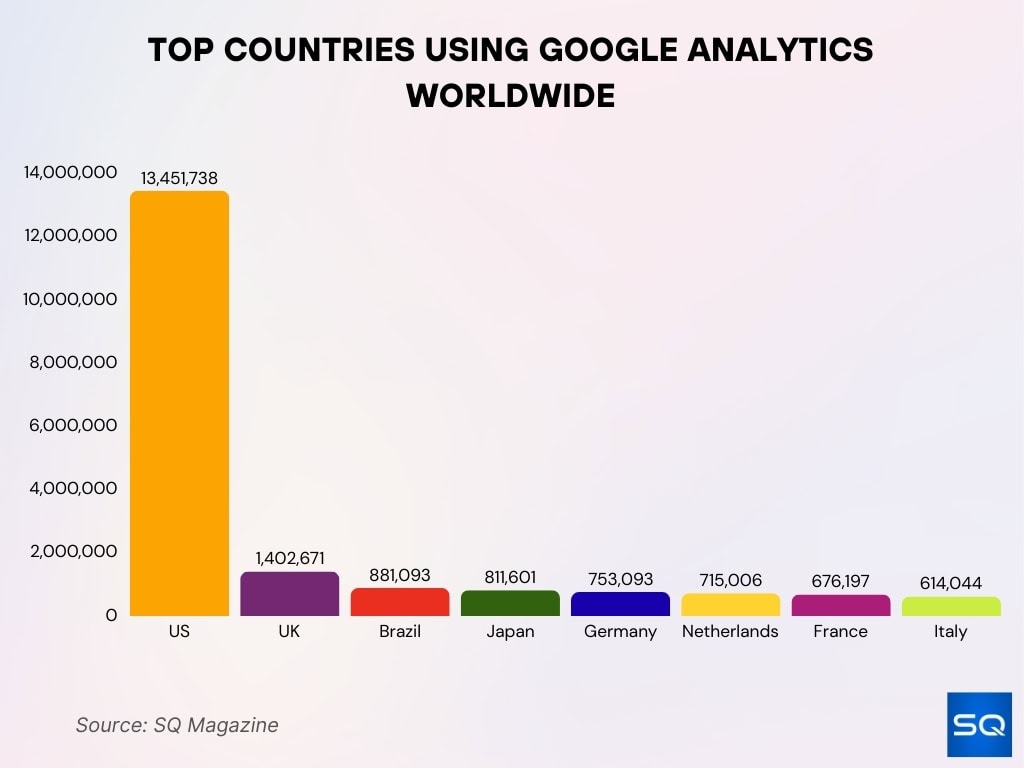
- The United States leads global Google Analytics adoption with 13,451,738 websites using the platform.
- The United Kingdom ranks second with 1,402,671 websites running Google Analytics.
- Brazil follows with 881,093 websites using Google Analytics across industries.
- Japan records 811,601 websites leveraging Google Analytics for tracking and insights.
- Germany has 753,093 websites using Google Analytics in its digital ecosystem.
- The Netherlands reports 715,006 websites using Google Analytics, indicating high penetration relative to size.
- France has 676,197 websites using Google Analytics for web analytics.
- Italy has 614,044 websites actively using Google Analytics to measure performance.
Data Accuracy and Sampling Limitations in GA4
- GA4 applies sampling in Exploration reports once a query processes more than 10 million events, while standard reports generally remain unsampled.
- Standard GA4 properties can handle up to 10 million events per single query before sampling, compared to 1 billion events in GA360 properties.
- Even with a 25% sample size, GA4 reports show an average error of only around 2%, with accuracy declining sharply below that threshold.
- GA4 real-time reports update within seconds, but standard and Exploration reports often have a 24–48-hour data freshness delay.
- GA4 processing delays can extend up to 5 days before data is fully stable and reliable for final reporting.
- Data thresholding in GA4 can hide detailed metrics for small user groups to protect privacy, especially when user counts drop below roughly 35–40 users or events.
Analytics Tools Used by Fortune 500 Companies
- Around 51% of Fortune 500 companies use Google Analytics on their main corporate website.
- Google Analytics adoption in the Fortune 500 grew from 45% to 51% within 9 months in the analyzed period.
- More than 30 additional Fortune 500 enterprises adopted or added Google Analytics in under a year.
- Web analytics market revenue is projected to reach $5.2 billion with a 17.6% CAGR through 2032, driven heavily by enterprise demand.
- 78% of businesses use analytics mainly for fundamental insights, while 22% need advanced enterprise-grade capabilities like those in Adobe Analytics.
- Over 54% of enterprises report major cost savings from using AI-driven analytics across their data stack.
- AI analytics investment is projected to hit $200 billion, with Fortune 500 firms among the largest contributors.
Comparison Between Google Analytics and Competitor Tools
- Google Analytics commands about 81.4% global web analytics market share, while Adobe Analytics holds around 0.1%.
- In the SEO category, Google Analytics captures 97.89% market share versus Adobe Analytics at 2.11%.
- Google Analytics is used by 21,706 SEO customers compared with 468 for Adobe Analytics.
- Google Analytics holds roughly 43% worldwide market share among web analytics technologies.
- Among the top 10,000 highest-ranking websites, GA4 is used by 43.35% of sites.
- GA4 is implemented on 33.65% of the top 1 million websites by traffic.
- Facebook Pixel for Shop holds about 12.36% market share as a key analytics and tracking alternative, with Hotjar at 3.44%.
- The global web analytics market size was $6.26 billion in 2025 and is projected to reach $7.36 billion in 2026, expanding GA and competitor tool adoption.
Google Analytics Usage Among E-commerce Platforms
- Over 237,000 Shopify stores use GA4, making it one of the most common analytics setups on the platform.
- More than 1.2 million WordPress-based stores (including many WooCommerce sites) have integrated GA4.
- GA4 is used by 14.8 million websites globally, a large share of which are e-commerce and retail brands.
- Google Analytics is utilized by 64% of the top 500 U.S. retailers for tracking online performance.
- Around 71% of small businesses rely on Google Analytics to guide online sales and marketing decisions.
- The average global e-commerce conversion rate sits between 2.5%–3%, typically measured and monitored through GA4.
- Retailers using unified commerce platforms like Shopify see up to 150% omnichannel GMV growth when pairing with robust analytics.
- Mobile devices generate over 60% of Shopify sales, magnifying the importance of GA4 event tracking for mobile commerce.
Frequently Asked Questions (FAQs)
Approximately 55.49 % of all websites use Google Analytics.
Over 14.2 million websites currently use GA4.
Approximately 98.1 % of Tag Manager users also use Google Analytics.
Google Analytics holds the largest market share globally, exceeding 80 % in some reports.
Conclusion
From a simple tracking tool to a core marketing intelligence platform, Google Analytics has evolved tremendously. The full transition to GA4 today marks a new chapter, one defined by real-time insights, predictive modeling, and greater privacy alignment.
This year’s data clearly shows that while the learning curve remains, organizations that embrace GA4’s capabilities are seeing real performance gains. Whether you’re optimizing a Shopify store or navigating complex B2B funnels, Google Analytics 4 isn’t just a dashboard; it’s a compass for digital growth.


