Last Updated: Apr 28, 2025

Imagine launching your favorite website only to find it sluggish or oddly formatted. You might not realize it immediately, but your browser choice plays a major role in that experience. In 2025, as the internet evolves faster than ever, browsers are battling fiercely for users’ attention, from prioritizing privacy features to fine-tuning mobile performance. Understanding browser statistics today isn’t just for tech nerds; it’s essential for marketers, developers, and everyday users who want the smoothest ride through the digital world. Let’s dive into the latest numbers shaping the web we live on.

Editor’s Choice

  • Google Chrome maintains its dominance in 2025, capturing 61.2% of the global market across all platforms.
  • Safari remains the second most popular browser, holding 19.4% of the worldwide market share.
  • Microsoft Edge has climbed to 6.8% of global market share, showing steady growth compared to 2024.
  • Mozilla Firefox continues to decline slightly, now sitting at 3.2% of global usage.
  • Opera secures 2.4% of the global market, gaining popularity in specific regions like Africa and Southeast Asia.
  • On mobile, Chrome leads with an impressive 65.8%, while Safari trails at 24.2%.
  • Brave Browser now commands 1.1% of the market, a jump from 0.6% last year, mainly driven by users prioritizing privacy.

Global Browser Market Share Overview

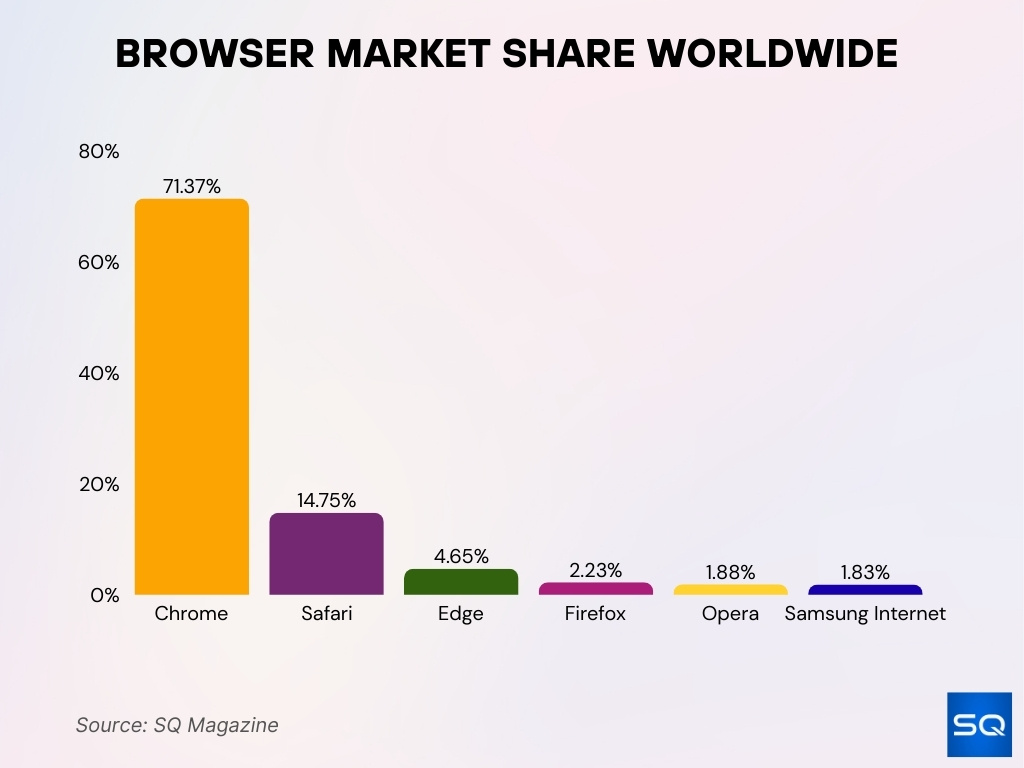
  • Chrome dominates the global browser market with a massive 68.38% share, maintaining its position as the industry leader.
  • Safari holds the second spot, capturing 17.09% of the global market, largely driven by iOS and macOS users.
  • Edge secures 4.92% of the market, benefiting from its integration with Windows systems.
  • Firefox commands 2.46%, continuing to appeal to users who prioritize privacy and customization.
  • Samsung Internet maintains 2.23% of the browser market, mainly supported by Samsung device users.
  • Opera accounts for 2.01%, popular among users seeking lightweight and data-saving browsers.
  • Others collectively make up 2.91% of the global market, covering a range of smaller or niche browsers.
Global Browser Market Share Overview
(Reference: Yaguara)

Desktop Browser Usage Statistics

  • Chrome dominates desktop browsing with a 64.9% market share as of March 2025.
  • Edge firmly holds second place on desktop at 13.4%, fueled by enterprise users and integration with Windows 11.
  • Safari commands 8.2% of desktop usage, primarily from macOS devices.
  • Firefox follows closely with 7.1% on desktop, maintaining a loyal base among tech-savvy users.
  • Opera clocks in at 2.6% of desktop browser share, seeing growth due to its VPN and lightweight performance features.
  • Brave has reached 1.3% on desktop in 2025, a significant rise from 0.8% in 2024.
  • Legacy browsers like Internet Explorer have dwindled to less than 0.2% of usage, with Microsoft officially ending support in 2023.
  • Chromebooks using ChromeOS contributed to 4.9% of desktop browser traffic, slightly up from last year.
  • Vivaldi and Tor Browser each represent around 0.5% combined usage on desktops.
  • In emerging markets, lightweight browsers such as Maxthon and Puffin account for less than 0.3% of desktop use.

Mobile Browser Usage Statistics

  • Chrome rules mobile with a 65.8% share in 2025, growing from 64.1% in 2024.
  • Safari is a strong runner-up, covering 24.2% of mobile browser usage.
  • Samsung Internet Browser holds 6.5% of the mobile market, primarily among Galaxy device users.
  • Opera Mini captures 1.9% of mobile browser use and is popular in regions with limited bandwidth.
  • UC Browser now stands at 1.7%, down from 2.4% last year.
  • Firefox for Android holds about 0.9% of the mobile market.
  • Brave Browser commands 0.7% mobile share, a jump compared to its 0.4% last year.
  • DuckDuckGo’s mobile browser has emerged with 0.4% usage due to growing interest in private browsing.
  • Microsoft Edge Mobile clocks at 0.5%, expanding through cross-device sync features.
  • Mobile-specific browsers like Puffin have a tiny yet steady share of 0.2%, especially in educational settings.

Safari Market Share by Region and Global

  • Africa: Safari holds a 9.52% browser market share across the continent.
  • Asia: Safari accounts for 12.35% of browser usage in the Asian market.
  • Americas: Safari leads with a strong 36.86% share across North and South America.
  • Europe: Safari captures 19.43% of the European browser market.
  • Oceania: Safari achieves a significant 28.92% market share in Oceania.
  • Global: Safari holds a 17.62% share of the total global browser market.
  • Chrome: Globally, Chrome continues to dominate with a 66.16% market share.
  • Other Browsers: All remaining browsers together account for the rest of the global share.
Safari Market Share by Region and Global (February 2025)
(Reference: My Codeless Website)

Browser Market Share by Region

  • In North America, Chrome leads with a 58.3% share, while Safari secures a significant 25.7%, driven heavily by iPhone users.
  • Europe shows a tighter competition, with Chrome at 55.4% and Safari growing to 20.1% in 2025.
  • In Asia-Pacific, Chrome maintains a whopping 70.2% share, aided by Android’s market dominance.
  • Africa has seen a surge in Opera Mini, which holds 9.6% of the regional mobile browser market.
  • South America reflects high Chrome loyalty, where it commands 68.9% of the overall market.
  • In Australia, Safari’s share has climbed to 27.4%, thanks to the rising use of Apple devices.
  • Middle Eastern countries favor Chrome at 64.1%, but Samsung Internet Browser has grown to 9.8%.
  • Russia and Eastern Europe users show more inclination toward Yandex Browser, which holds 6.5% locally.
  • India sees Chrome at 74.6% dominance, while UC Browser usage continues a slow decline.
  • Japan has a slightly different split, where Safari boasts a 35.1% share on mobile devices.

Trends in Browser Popularity Shifts

  • Chrome’s market share slipped slightly from 63.5% to 61.2%, reflecting user interest in privacy alternatives.
  • Safari experienced a growth of 0.7% globally, largely driven by enhanced privacy settings and seamless device ecosystem integration.
  • Microsoft Edge showed a 13% year-over-year growth due to improvements in speed, efficiency, and AI integrations.
  • Firefox lost 0.4% of its market, attributed to stiff competition from newer privacy-focused browsers.
  • Brave saw its user base increase by 45%, largely because of its ad-blocking and crypto rewards features.
  • Lightweight browsers like Opera Mini and Puffin are witnessing niche growth in regions with limited internet access.
  • Samsung Internet usage has expanded by 8% year-over-year, especially among mid-range smartphone owners.
  • Vivaldi’s desktop version grew its user base by 18%, mainly among tech enthusiasts and developers.
  • Mobile-only browsers such as DuckDuckGo have grown by 12% YoY in the privacy-first segment.
  • Arc Browser, a new entrant, has begun gaining traction in design and creative communities, with a 0.2% global share.

Feature Ratings of Best Anti-Detect Browsers for Mobile

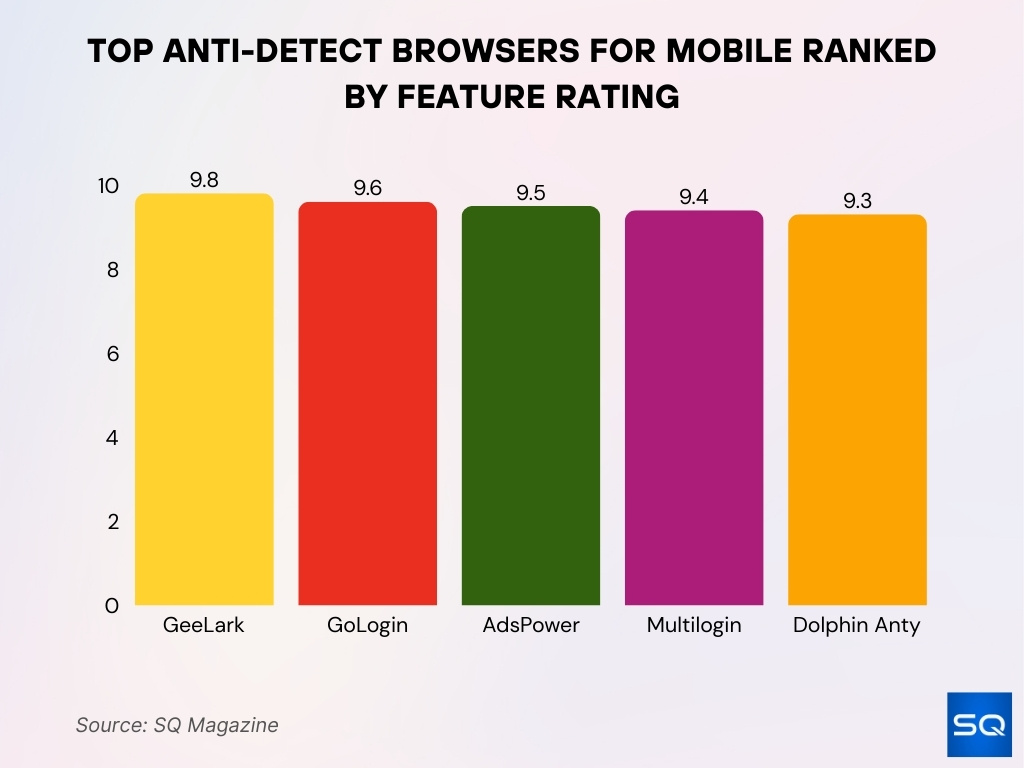
  • GeeLark leads the feature ratings with 20.6%, making it the top choice among mobile anti-detect browsers.
  • GoLogin secures a strong 20.2% rating, offering highly competitive mobile browser features.
  • AdsPower holds a 20.0% share, closely following the top contenders in feature performance.
  • Multilogin achieves a 19.7% rating, maintaining a solid reputation for mobile anti-detect capabilities.
  • Dolphin Anty earns a 19.5% rating, rounding out the top five browsers for mobile feature quality.
Feature Ratings of Best Anti-Detect Browsers for Mobile
(Reference: AffMaven)

Emerging Browsers and New Entrants

  • Arc Browser has captivated designers and creative professionals with a fresh, workspace-based browsing experience.
  • Mullvad Browser, launched in partnership with the Tor Project, focuses exclusively on maximum anonymity.
  • Orion Browser for Mac users gained a small but loyal following with built-in ad-blockers and near-instant speed.
  • Sidekick Browser targets productivity-focused users and has grown its market share by 0.1% in under a year.
  • Brave Search integration into Brave Browser is driving a 2x user engagement compared to external search reliance.
  • Aloha Browser, popular in Latin America, doubled its mobile user base due to free VPN services.
  • Cliqz Browser re-entered the scene with a privacy-first update after a major revamp in late 2024.
  • Beaker Browser, focused on peer-to-peer browsing, retains a small but notable cult following among technophiles.
  • Min Browser appeals to minimalist users, showing a 0.02% growth in alternative browser markets.
  • Puffin Secure Browser launched a dedicated education version, growing by 18% in school adoption rates.

Browser Security and Privacy Features Comparison

  • Brave leads the pack with full default ad-blocking, native Tor integration, and encrypted sync features.
  • Safari introduced Advanced Tracking Protection (ATP) in iOS 18, reducing cross-site tracking by 40%.
  • Edge expanded its Microsoft Defender SmartScreen, blocking 23% more phishing sites than Chrome in independent tests.
  • Firefox enhanced its Total Cookie Protection system, now the default for all users in 2025.
  • Chrome released its Privacy Sandbox features to 80% of users but faced criticism for being too advertiser-friendly.
  • Opera added VPN Pro, offering unlimited bandwidth and no-logging policies for premium users.
  • Samsung Internet quietly leads mobile encryption benchmarks, ranking #1 for HTTPS usage consistency on Android.
  • Vivaldi offers per-tab encryption and real-time tracker statistics, appealing to more privacy-conscious desktop users.
  • Mullvad Browser disables telemetry by default, ensuring that no usage data is sent back to servers.
  • Tor Browser remains the gold standard for full anonymity but struggles with mainstream adoption due to slower load times.

Most Common Google Chrome Vulnerabilities

  • Denial of Service is the most reported vulnerability, with 825 instances, posing significant disruption risks.
  • Overflow vulnerabilities are the second most common, having been recorded 351 times.
  • Bypass Something vulnerabilities appear 276 times, allowing attackers to bypass security restrictions.
  • Gain Information issues were found 157 times, exposing user or system data.
  • Execute Code vulnerabilities occurred 116 times, allowing for potential remote code execution.
  • Memory Corruption incidents were recorded 94 times, risking system stability.
  • XSS (Cross-Site Scripting) vulnerabilities were noted 72 times, impacting website security.
  • CSRF (Cross-Site Request Forgery) vulnerabilities were very rare, with only 3 cases reported.
  • Directory Traversal vulnerabilities had 2 cases, enabling unauthorized file access.
  • Gain Privilege vulnerabilities also had just 2 occurrences, risking elevated system access.
Most Common Google Chrome Vulnerabilities
(Reference: TrueList)

Impact of Browser Updates on User Retention

  • Chrome’s release cycles have shortened to 4 weeks, leading to faster security patches and feature rollouts.
  • Firefox reported a 5% increase in user retention after the Proton UI update was fully adopted in 2024.
  • Edge’s AI features, like sidebar search, have contributed to a 12% user increase in Microsoft services.
  • Safari’s speed optimization updates resulted in an 8% higher user satisfaction rating in Q1 2025.
  • Opera’s built-in AI summarization tool attracted a 6% new user boost, primarily among knowledge workers.
  • Samsung Internet improvements in one-handed browsing UX led to 9% better retention on mid-size Android phones.
  • Brave Browser updates focusing on crypto wallets caused a 30% spike in financial services users.
  • Vivaldi’s customizable themes and keyboard shortcuts increased daily active usage by 7%.
  • Tor Browser updates enhanced site load speeds by 15%, leading to a modest user loyalty growth.
  • Arc Browser’s personalized browsing spaces drove an 18% boost in week-over-week active user engagement after their late 2024 relaunch.

User Preferences: Speed, Extensions, and Interface

  • In a 2025 survey, 78% of users cited speed as their primary factor when choosing a browser.
  • 68% of users prioritize access to a wide extensions, especially on desktop platforms.
  • Chrome consistently ranks highest for perceived browsing speed, followed closely by Safari.
  • Firefox leads in customizability, with users giving it a 92% satisfaction rating for extension management.
  • Edge’s vertical tabs feature improved workspace management for 26% of users, boosting multitasking efficiency.
  • Safari‘s tab grouping introduced in macOS Sequoia improved user productivity ratings by 12% year-over-year.
  • Minimalist browsers like Brave and Vivaldi scored high among users seeking distraction-free interfaces.
  • Opera’s sidebar gained popularity among creative professionals, with a 15% increase in reported use cases.
  • Mobile-first designs, such as one-handed modes on Samsung Internet, influenced 23% of users to switch browsers.
  • Dark Mode adoption has reached 89% among mobile users, becoming a near-essential feature.

Browser Memory Usage (With 5 Tabs Open on Typical Sites)

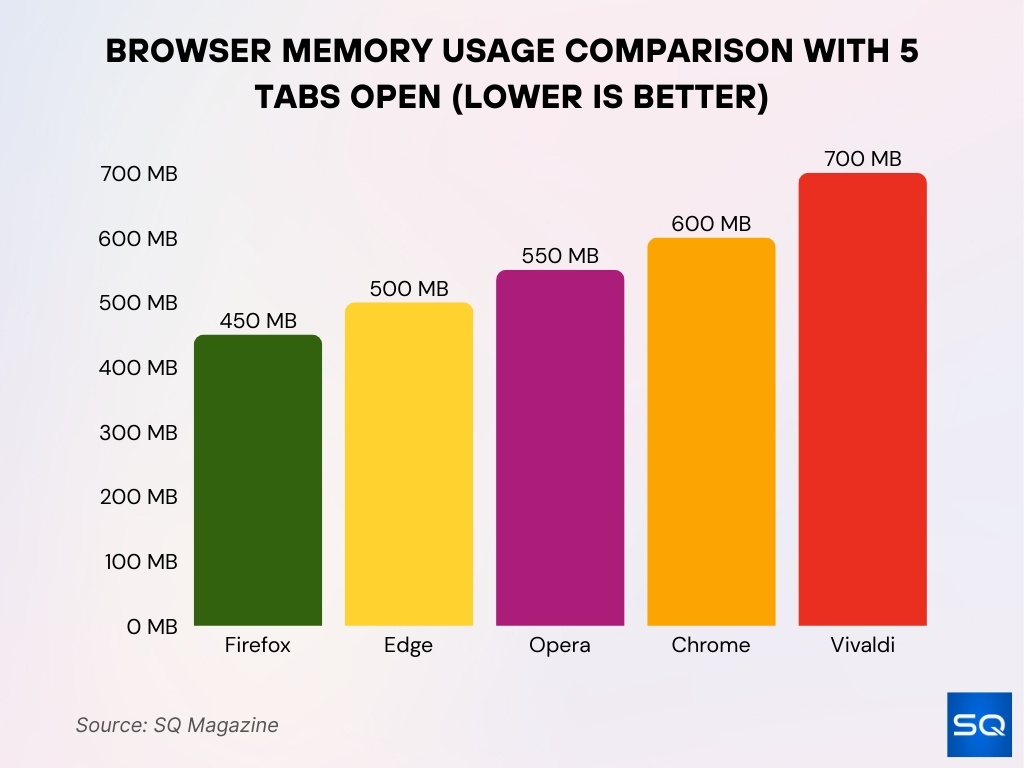
  • Firefox is the most memory-efficient, using only 351.20 MB with 5 tabs open.
  • Safari consumes 619.60 MB of memory, almost double that of Firefox.
  • Opera slightly exceeds Safari, using 630.40 MB of memory across 5 tabs.
  • Chrome demands 756.90 MB of memory, making it one of the heavier browsers.
  • Vivaldi tops the list with the highest memory usage at 891.30 MB.
Browser Memory Usage (With 5 Tabs Open on Typical Sites)
(Reference: Process Street)

Browser Usage Trends Among Developers

  • Firefox Developer Edition remains the top choice for web developers, used by 34% of coding professionals globally.
  • Chrome DevTools still dominates, with 88% of developers citing it as their primary debugging tool.
  • Safari Technology Preview gained traction among Mac developers, with usage growing 15% year-over-year.
  • Edge’s WebView2 is used in 27% of new Windows desktop app development projects.
  • Brave’s developer tools usage rose by 8%, particularly for projects focused on Web3 and blockchain integrations.
  • Opera GX, marketed to gaming developers, showed a 20% rise in developer downloads compared to last year.
  • Vivaldi gained niche popularity among backend developers for its built-in note-taking and session-saving features.
  • Mobile developers preferred Samsung Internet DevTools, with 18% reporting regular use for mobile optimization.
  • Puppeteer and Selenium automation tests were most frequently run on Chrome and Edge instances.
  • Privacy-focused devs increasingly test compatibility with Tor Browser, ensuring anonymized experiences.

Influence of Default Browsers on Market Share

  • Safari’s dominance on iPhones accounts for 92% of default browser usage among iOS users.
  • Chrome remains the default on most Android devices, contributing 85% of its mobile market share.
  • Edge’s automatic inclusion on Windows 11 helped boost its desktop presence by 4% year-over-year.
  • In the Chromebook ecosystem, ChromeOS Browser retains 100% of the pre-installed market share.
  • Users who manually change their default browser tend to favor Chrome (58%), followed by Brave (14%).
  • Regulatory changes in the EU’s Digital Markets Act prompted a 7% decrease in forced default browser usage.
  • Firefox saw a 3% boost in Europe after mandatory choice screens were introduced on Android phones.
  • Samsung Internet retained 73% of default browser usage on Samsung devices, despite Google pushing Chrome.
  • Opera partnered with smaller OEMs to become the default browser on 12 million devices in 2025.
  • Vivaldi continues to court Linux distributions, appearing as the default option in select community distros.

Internet Users by Device Distribution

  • Mobile Users dominate the internet landscape, accounting for 55.73% of total users.
  • Desktop Users represent a significant portion, with 41.46% of internet usage.
  • Tablet Users make up the smallest segment at 2.81% of internet users.
Internet Users by Device Distribution
(Reference: Genspark AI)

Browser Adoption in Different Age Demographics

  • Among users aged 18-24, Chrome captures 69% of browser usage, mainly for its speed and Google integration.
  • Safari dominates users aged 25-34, holding 24% of market share in this group due to brand loyalty to Apple.
  • Privacy-first browsers like Brave and DuckDuckGo Browser see their highest adoption among the 25-39 age group.
  • Firefox appeals strongly to users aged 35-44, with 11% of that demographic preferring it.
  • Users aged 45-54 are more loyal to Edge, reflecting a comfort with Microsoft’s ecosystem.
  • Opera Mini finds a surprising 8% popularity spike among users aged 18-22 in African and Southeast Asian countries.
  • Older users (55+) prefer Safari and Edge, citing simpler interfaces and security trust as the main reasons.
  • Samsung Internet holds steady among users aged 30-40, thanks to its optimization on Galaxy devices.
  • Vivaldi and Tor Browser show minor upticks among privacy-aware users aged 18-29.
  • Default browser inertia (not switching from pre-installed browsers) is strongest among users aged 50 and above.

Recent Developments

  • Google Chrome announced a phasing out of third-party cookies fully by the end of 2025, altering online ad targeting.
  • Safari introduced Private Relay as a standard feature in macOS Sequoia and iOS 18, bolstering anonymity.
  • Microsoft Edge launched AI-powered Read Aloud 2.0, enhancing accessibility for visually impaired users.
  • Firefox deployed Version 125, featuring built-in video conferencing privacy enhancements.
  • Brave Browser integrates native crypto payment channels for faster blockchain transactions.
  • Opera invested heavily in AI summarization technology, launching it across both desktop and mobile apps.
  • Samsung Internet announced seamless SmartThings integration, enabling IoT-driven browsing.
  • Tor Browser updates allow for faster onion service access by 25%, boosting the usability of hidden websites.
  • Vivaldi unveiled Built-in Mastodon Integration, bringing social media into the browsing experience natively.
  • Arc Browser teased major updates around AI-driven tab management, expected for late 2025.

Conclusion

The battle for browser supremacy in 2025 is more dynamic than ever. While Chrome continues to lead the charge globally, challengers like Brave, Edge, and Safari are carving out strongholds with innovations in privacy, speed, and user experience. User expectations have shifted dramatically — speed, minimalism, security, and personalization now outweigh simple brand loyalty. Emerging browsers show that niche needs are rising fast, and regulatory changes hint that market shares could further fragment over the next few years. In this ever-shifting web landscape, the true winner will be the browser that can adapt the fastest to user desires and technological evolution.

Sources


ABOUT AUTHOR