WHAT WE HAVE ON THIS PAGE
- Editor’s Choice
- Distribution of Global Instagram Users by Age
- Total Number of Instagram Users Worldwide
- Instagram Demographics by Age and Gender
- Instagram User Growth Worldwide (2020–2025)
- Top Countries by Instagram Users
- Average Time Spent on Instagram Daily
- Instagram User Demographics in the United States
- Instagram Usage Trends in 2025
- Instagram Stories and Reels Engagement Rates
- Instagram Users by Generation
- Instagram Influencer Marketing Statistics
- Instagram Business and Advertising Performance
- Confidence in ROI: Social Listeners vs. Non-Listeners (2025)
- Most Followed Accounts and Top Content Categories
- Instagram Shopping and eCommerce Statistics
- Most Popular Instagram Content Types Globally
- Video Content vs. Image Content Performance
- Instagram Algorithm Insights and Impact on Reach
- Mobile Usage and App Download Rankings
- Security, Privacy, and User Behavior Trends
- Recent Developments
- Conclusion
- Sources
On a rainy afternoon in 2010, a humble photo of a dog became the first image ever uploaded to what would soon become a global phenomenon—Instagram. Fast forward to 2025, and what began as a simple photo-sharing app is now a digital ecosystem fueling businesses, trends, and social movements across the world. Whether you’re a marketer measuring engagement, a brand planning your next campaign, or just curious about how deep Instagram’s reach goes, understanding the platform’s evolving statistics is essential.
In this article, we’re unpacking the latest Instagram stats of 2025, highlighting usage patterns, growth by region, demographic shifts, and performance trends to keep you in the know.
Editor’s Choice
- Instagram surpassed 2.6 billion monthly active users globally by Q1 2025, reflecting a 10% year-over-year increase.
- Over 70% of Instagram’s user base is under the age of 35, with Gen Z making up the largest single demographic group.
- The United States, India, and Brazil remain the top three countries by user count, with the US housing over 193 million active users.
- Users now spend an average of 33 minutes per day on Instagram, with Reels accounting for 39% of the total time spent.
- Business accounts grew to over 350 million, showing a 17% YoY increase, with small businesses making up nearly 65% of that figure.
- Instagram Reels generate 2x more engagement than traditional photo posts in 2025.
- 94% of marketers say Instagram is critical to their influencer marketing strategy, up from 89% in 2024.
Distribution of Global Instagram Users by Age
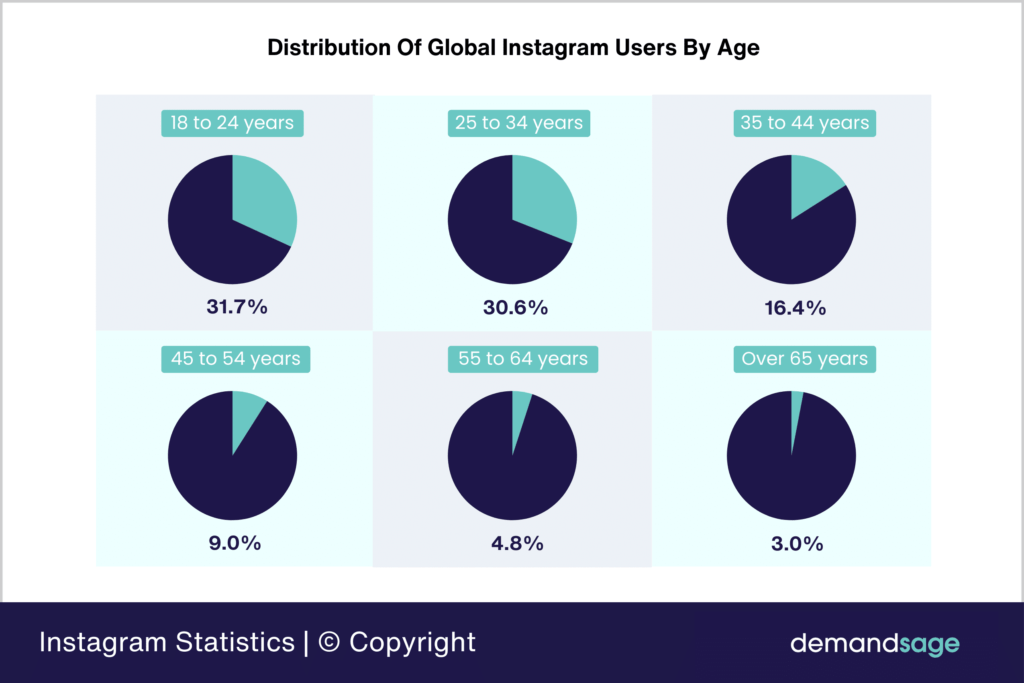
- Only 3.0% of Instagram users are over 65 years old, indicating minimal usage by senior demographics. However, this number could grow as digital literacy increases in older generations.
- Ages 18 to 24 make up the largest portion of Instagram’s user base, accounting for 31.7% of global users. This highlights the platform’s strong popularity among younger adults.
- Users aged 25 to 34 are a close second, comprising 30.6% of Instagram’s global user base. This age group remains a key demographic for advertisers and influencers.
- The 35 to 44 age group represents 16.4% of Instagram users globally. While not the majority, they still form a considerable segment of the platform’s audience.
- Users aged 45 to 54 account for 9.0% of the total Instagram audience. Engagement in this age bracket is growing steadily over time.
- The 55 to 64 age group makes up 4.8% of global users. This reflects a smaller yet gradually expanding adoption of Instagram among older users.
Total Number of Instagram Users Worldwide
- As of early 2025, Instagram hosts over 2.6 billion active users, an increase from 2.36 billion in 2024.
- Approximately 410 million new users joined Instagram in 2024, marking one of the platform’s highest annual user growth spikes.
- Instagram is now the third most-used social media platform, behind only Facebook and YouTube.
- Over 78% of global internet users aged 13 to 64 report having an Instagram account.
- The platform sees approximately 100 million daily active uploads, including stories, reels, and posts.
- Asia-Pacific leads in user volume, with more than 1.1 billion users, fueled largely by India, Indonesia, and the Philippines.
- In Europe, Instagram has seen a 7% growth YoY, reaching 332 million users in 2025.
- The African region, while still growing, reached 168 million users, with Nigeria and South Africa leading the charge.
- Latin America holds 295 million active users, with Brazil contributing more than 140 million alone.
- Instagram Lite, aimed at low-data users, now has over 50 million installs across emerging markets.
Instagram Demographics by Age and Gender
- Gen Z (ages 18–24) makes up the largest demographic, representing 30.8% of Instagram’s user base in 2025.
- Users aged 25–34 account for 29.1%, making Millennials the second-largest group.
- The 35–44 age group now comprises 14.6%, while users aged 45–54 make up 9.2% of all users.
- The fastest-growing segment is users aged 55 and older, up 11% year-over-year.
- Women represent 51.3% of Instagram’s user base, with men at 48.4%, and the remainder identifying as non-binary or preferring not to say.
- In the US, 62% of teens say Instagram is their primary social media platform, just ahead of TikTok.
- The platform is especially popular among urban users, with 68% of users living in metropolitan areas.
- Among Gen Z, 47% follow at least one micro-influencer, compared to 31% among Millennials.
- The gender gap is narrowing in regions like the Middle East and South Asia, where female participation increased by 13% compared to 2024.
- A surprising 9% of Instagram users in 2025 are aged 13–17, suggesting the platform still maintains a strong foothold among younger teens.
Instagram User Growth Worldwide (2020–2025)
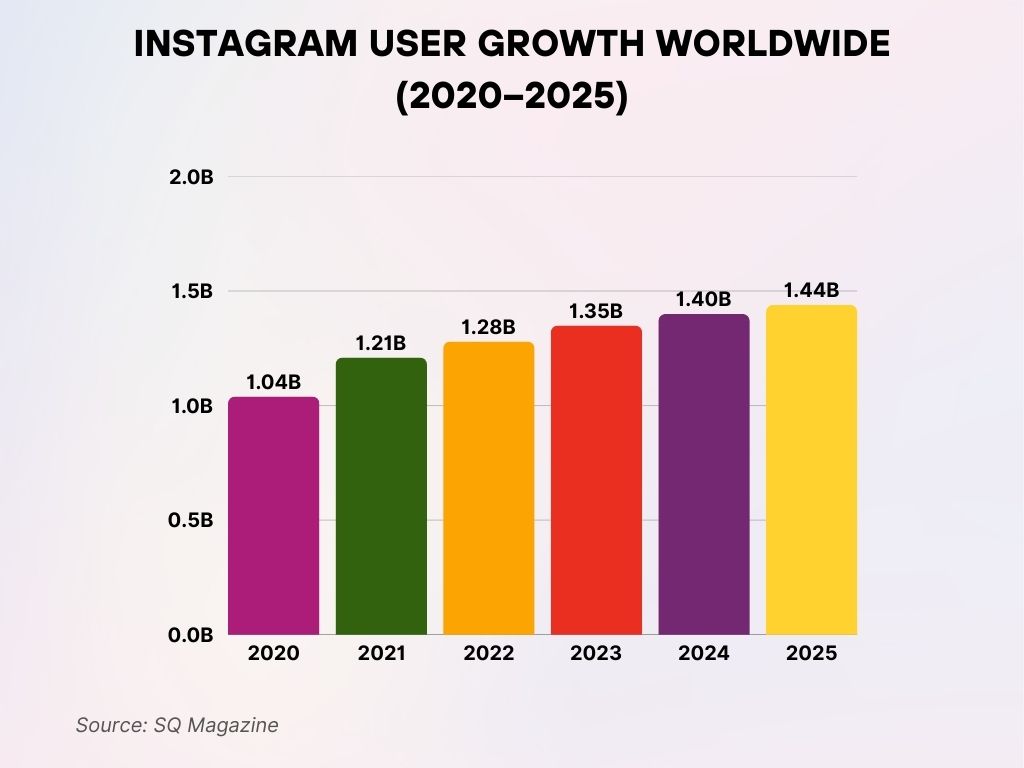
- By 2025, Instagram’s global user count is forecasted to reach 1.44 billion, highlighting its sustained dominance in the social media space.
- In 2020, Instagram had 1.04 billion users worldwide. This marked the platform’s solid entry into the billion-user club.
- By 2021, global users grew to 1.21 billion, showing a strong annual increase of 170 million users.
- In 2022, the number of users reached 1.28 billion. This represents continued momentum as Instagram expands its global reach.
- The user base was projected to hit 1.35 billion in 2023, further reflecting Instagram’s growing popularity across markets.
- For 2024, Instagram was expected to have 1.40 billion users, indicating a steady upward trend in adoption.
Top Countries by Instagram Users
- India remains the top country, with nearly 390 million active Instagram users as of March 2025.
- The United States ranks second, boasting 193 million users, which is 58% of the total U.S. population.
- Brazil holds third place with 140 million users, reflecting the platform’s strong foothold in Latin America.
- Indonesia ranks fourth, reporting 120 million users, driven by increased smartphone access and digital literacy.
- Russia and Turkey each have over 65 million users, placing them among the top ten globally.
- In Europe, Germany has 34 million users, followed closely by France at 31 million.
- The UK Instagram community grew to 35.6 million users, showing a 5% YoY rise.
- In the Middle East, Saudi Arabia and the UAE show a combined total of over 31 million active users.
- Nigeria leads in Africa with 41 million users, while South Africa trails with 26 million.
- Canada rounds out the top tier with 23 million active users, showing steady but modest growth.
Average Time Spent on Instagram Daily
- The average global user spent 33 minutes per day on Instagram in 2025.
- This marks an increase from 29.5 minutes in 2024, driven by longer engagement with Reels and Shopping features.
- Reels now account for 39% of time spent, more than any other content format.
- Stories occupy 26% of the average user’s time, making them the second most engaging format.
- Instagram Shopping usage has increased, with 15% of total time spent now tied to browsing product tags and storefronts.
- Among Gen Z, daily usage peaks at 49 minutes, the highest across all demographics.
- Millennials (ages 25–40) spend an average of 37 minutes daily, with most of it split between Reels and Stories.
- Users aged 55+ saw an 18% increase in time spent YoY, averaging 19 minutes per day.
- Desktop usage declined to just 6% of total Instagram interactions, highlighting the app’s mobile-first engagement.
- On weekends, Instagram usage increases by 12%, with peak times occurring between 6 PM and 9 PM local time.
Instagram User Demographics in the United States
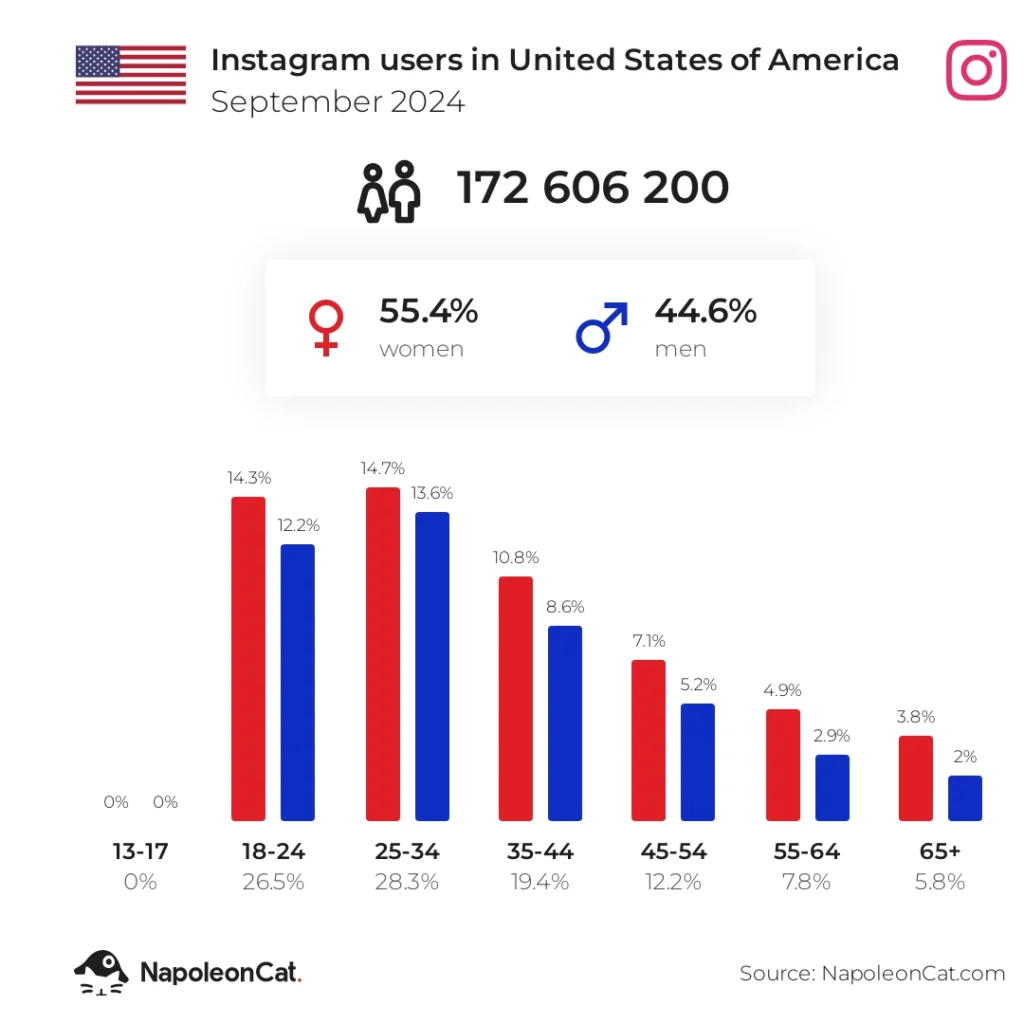
- Teens aged 13–17 show 0% representation, likely due to privacy restrictions or underreporting in this demographic.
- The total number of Instagram users in the US reached 172.6 million in September 2024, showing widespread platform penetration.
- Women make up 55.4% of Instagram’s US user base, while men represent 44.6%, indicating a stronger female presence on the platform.
- The 25–34 age group is the largest demographic, comprising 28.3% of all US Instagram users (with 14.7% women and 13.6% men).
- Users aged 18–24 follow closely at 26.5%, split into 14.3% women and 12.2% men, highlighting strong Gen Z engagement.
- The 35–44 age group accounts for 19.4% of users (10.8% women, 8.6% men), showing solid millennial participation.
- 12.2% of users are aged 45–54, with 7.1% women and 5.2% men, indicating moderate mid-age activity.
- The 55–64 group holds 7.8% of the audience (4.9% women, 2.9% men), while seniors aged 65+ make up 5.8% (3.8% women, 2% men).
Instagram Usage Trends in 2025
- In 2025, over 74% of US adults aged 18–29 use Instagram at least once per day, a 5% increase from last year.
- Instagram Reels’ viewership grew by 27% year-over-year, becoming the app’s fastest-growing feature.
- The average user now follows 398 accounts, up from 362 in 2024, indicating a more connected community.
- Over 62% of users say they use Instagram as their primary source of discovering new brands.
- Instagram’s desktop platform accounts for only 4.2% of total usage, further cementing its mobile-first dominance.
- 68% of users open the app multiple times a day, with 21% checking it more than 10 times daily.
- 75% of Instagram users under age 35 interact with at least one Story daily.
- Night-time scrolling has become a trend, with 40% of users saying they primarily browse Instagram between 9 PM and midnight.
- In the US, Instagram is now the second most-used app overall, trailing only YouTube.
- Voice and audio notes in DMs have seen a 2x rise in usage since their introduction in late 2023.
Instagram Stories and Reels Engagement Rates
- The average completion rate for Stories is now 86%, up from 79% in 2024, signaling greater user interest.
- Reels generate 43% higher engagement than regular video posts, with an average watch time of 17.4 seconds.
- Brands using Reels report a 55% higher conversion rate, especially in the fashion and beauty industries.
- The average tap-forward rate for Stories is 15.7%, while the exit rate dropped to 4.1%, suggesting more compelling content.
- Instagram Reels are shared 1.5 billion times daily, underscoring their viral potential.
- Influencers with under 100K followers see 18% higher engagement on Reels than those with larger audiences.
- Reels uploaded between Wednesday and Friday at 1–3 PM get the most engagement in 2025.
- Animated stickers and music overlays in Stories have been shown to boost views by 28%.
- Video captions in Reels are now present in 72% of posts due to their impact on retention and accessibility.
- Branded Reels with UGC (user-generated content) see a 4.6% higher click-through rate compared to polished, studio-shot content.
Instagram Users by Generation
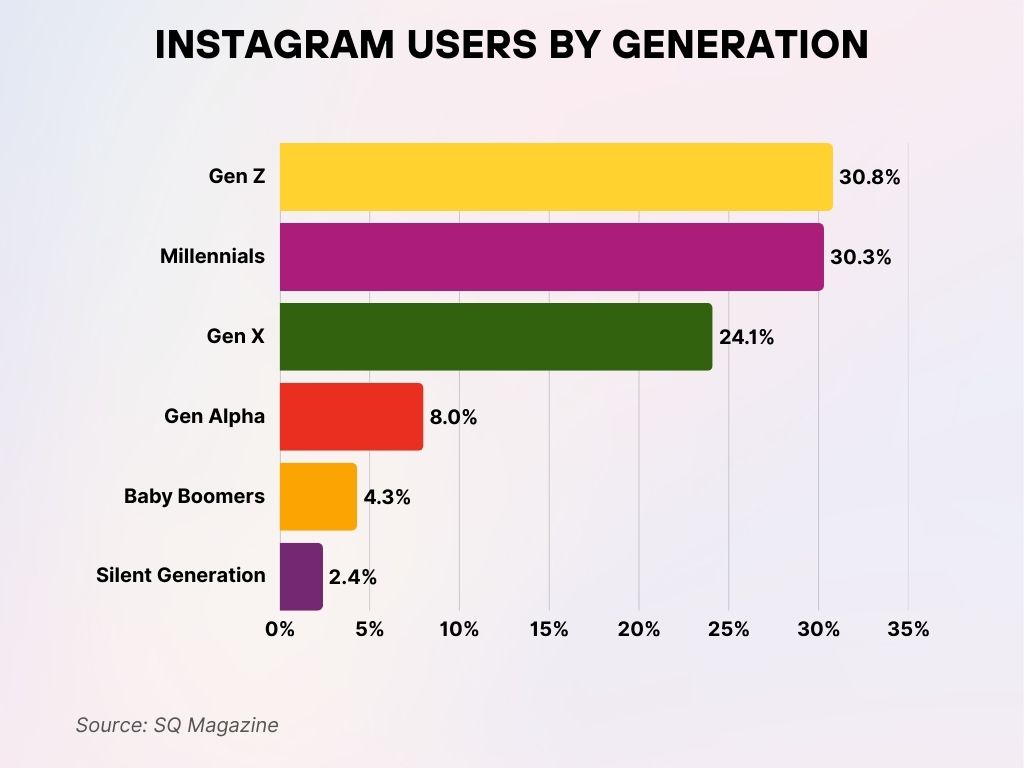
- The Silent Generation holds a 2.4% share, reflecting minimal engagement from users aged 75 and above.
- Gen Z makes up the largest share of Instagram users at 30.8%, showing the platform’s strong appeal among digital natives.
- Millennials closely follow at 30.3%, confirming their continued engagement and influence on the app.
- Gen X represents 24.1% of Instagram’s user base, proving that the platform has a wide generational reach beyond younger audiences.
- Gen Alpha accounts for 8.0% of users, indicating early adoption by the youngest generation now entering social platforms.
- Baby Boomers comprise 4.3% of Instagram users, showing modest but notable usage among older adults.
Instagram Influencer Marketing Statistics
- The influencer marketing industry on Instagram is projected to reach $22.3 billion in 2025, up from $18.2 billion in 2024.
- Over 94% of brands plan to maintain or increase their Instagram influencer budgets this year.
- Nano-influencers (1K–10K followers) have the highest engagement rate at 4.3%, compared to 1.7% for mega-influencers.
- Sponsored Stories generate 25% more engagement than feed posts, largely due to interactive elements.
- The average cost per sponsored Instagram post in the US is $1,342 for macro-influencers (100K–1M followers).
- Beauty, fashion, and fitness are the top three niches dominating Instagram influencer partnerships.
- 58% of influencers use Instagram as their primary revenue platform, ahead of TikTok and YouTube.
- Authenticity drives ROI—campaigns using unscripted posts receive 31% more engagement than overly branded content.
- Hashtags are used in 89% of influencer posts, but fewer than 5 per post yields the best performance in 2025.
- AI-powered influencer discovery tools are now used by 64% of brands, streamlining partnerships and ROI tracking.
Instagram Business and Advertising Performance
- Instagram ad revenue is forecasted to hit $67.8 billion in 2025, up from $60.1 billion in 2024.
- Instagram accounts for 32% of Meta’s total ad revenue, demonstrating its advertising dominance.
- Carousel ads yield 35% more conversions than single-image ads, especially for e-commerce brands.
- Stories ads see an average CTR of 0.78%, while Reels ads enjoy a slightly higher 0.84% CTR.
- The average CPC for Instagram ads in the US is $1.49, with fashion and travel sectors paying the highest.
- 80% of Instagram users follow at least one business account, showing the platform’s role in brand-consumer relationships.
- Instagram lead-gen ads have a 19% higher conversion rate than Facebook’s in comparable campaigns.
- Video ads with subtitles outperform those without by 33% in terms of engagement and retention.
- Branded content tools are now used in over 70% of paid partnerships, ensuring better disclosure and transparency.
- Instagram ads now reach 1.84 billion users, accounting for 71% of total platform users.
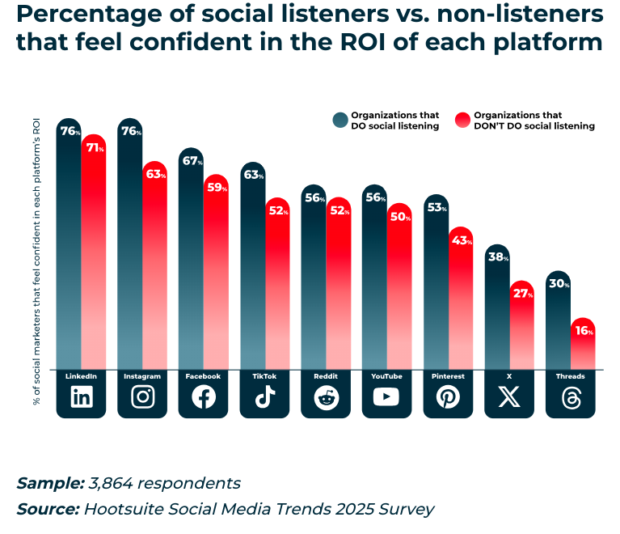
- The data underscores that social listening significantly boosts marketers’ confidence across nearly all platforms.
- LinkedIn leads in ROI confidence, with 76% of social listeners feeling confident, compared to 61% of non-listeners.
- Instagram matches LinkedIn at 76% for listeners but drops to 63% for non-listeners, reflecting its strong performance when social listening is applied.
- Facebook has 67% ROI confidence among listeners but only 59% among non-listeners, showing a moderate gap.
- TikTok shows 63% ROI confidence for listeners vs. 52% for non-listeners, underlining its growing marketing trust.
- Reddit sees 56% ROI confidence among listeners and 52% for non-listeners—less variation but still notable.
- YouTube delivers 56% ROI confidence for listeners and 50% for non-listeners, demonstrating stability in perceived value.
- Pinterest shows a steeper drop: 53% of listeners vs. 43% of non-listeners feel confident in its ROI.
- X (formerly Twitter) has a sharp contrast, with only 38% of listeners and 27% of non-listeners expressing ROI confidence.
- Threads ranks lowest, with 30% of listeners and just 16% of non-listeners confident in its ROI.
Most Followed Accounts and Top Content Categories
- Cristiano Ronaldo remains the most-followed person on Instagram, with 670 million followers as of April 2025.
- The most-followed woman is Selena Gomez, who crossed 480 million followers this year.
- Instagram’s official account continues to lead brands with over 685 million followers.
- Top content categories include fashion, music, sports, travel, and beauty, with fashion posts receiving 30% higher save rates.
- National Geographic remains the most-followed media brand, with 291 million followers.
- User-generated content accounts for 42% of viral posts in 2025, more than any previous year.
- The #OOTD (Outfit of the Day) hashtag still ranks among the top 10, with over 450 million uses.
- Instagram Live is resurging, with 18% YoY growth in active usage, especially among creators and brands.
- The top-performing Reels creators are averaging 12.6 million monthly views, often exceeding engagement on YouTube Shorts.
- Pet content has seen a surprising 24% growth in engagement—#dogsofinstagram and #catsoftiktok both trend weekly.
Instagram Shopping and eCommerce Statistics
- Instagram Shopping is used by over 650 million users monthly, making it a central hub for product discovery in 2025.
- 41% of Gen Z consumers say they’ve made a purchase directly through Instagram in the past 30 days.
- Instagram Shops saw a 22% increase in conversions YoY, outperforming standalone mobile sites in 2025.
- Product tags in posts increase engagement by 37%, especially when used with Reels or carousel content.
- The average order value for purchases made through Instagram is now $74.83, up from $68.10 in 2024.
- 73% of users say Instagram helps them decide what to buy, making it a leading platform for product research.
- Shoppable Stories drive swipe-up conversion rates of 1.4%, up from 1.1% last year.
- Beauty, wellness, and home decor are the top three categories benefiting from Instagram Shopping growth.
- Instagram Checkout is now available in 27 countries, expanding rapidly in Southeast Asia and Latin America.
- Over 250 million businesses now use Instagram to promote or sell products, including direct-to-consumer brands and big-box retailers.
Most Popular Instagram Content Types Globally
- Helpful content is valued by 28%, underlining a niche but important space for utility and problem-solving posts.
- Funny content ranks highest, preferred by 50% of users. Humor clearly drives engagement and wide sharing on Instagram.
- Creative posts are favored by 46% of users, highlighting the platform’s appeal to visual innovation and originality.
- Informative content attracts 41% of users, showing a strong appetite for educational and value-driven posts.
- Relaxing content is popular with 37% of users, reflecting demand for calm, feel-good experiences on the feed.
- Engaging posts are liked by 36% of users, emphasizing the importance of interaction and connection.
- Inspirational content also appeals to 36% of users, resonating with motivational themes and personal growth.
- Trendy content is appreciated by 35% of Instagram users, revealing the influence of current events and viral moments.
- Exciting content holds the attention of 34%, proving the value of energetic and dynamic storytelling.
- Relevant content appeals to 33% of users, reinforcing the need for topical and audience-specific themes.

Video Content vs. Image Content Performance
- In 2025, video content generates 2.4x more engagement than image posts.
- Reels receive an average of 27% more comments than traditional videos and 68% more shares than static posts.
- Image posts still perform well in niche categories like photography and design, where they account for 46% of top-performing content.
- Carousel posts with video as the first slide result in 32% higher swipe-through rates than static-only carousels.
- Short-form videos under 30 seconds get 54% more views than longer content.
- Posts combining text overlays and subtitles in videos outperform non-captioned content by 33%.
- Live video engagement rose by 19% in 2025, with creators streaming more frequently to build direct audience connections.
- Despite video dominance, 42% of users say they still prefer static posts for educational or text-heavy content.
- Instagram’s algorithm prioritizes Reels in the Explore feed, giving them a 3.1x higher discovery rate than photo posts.
- Brands posting Reels three times per week saw a 23% increase in follower growth compared to those posting less frequently.
Instagram Algorithm Insights and Impact on Reach
- The 2025 Instagram algorithm weighs recency, engagement rate, and content type as top ranking factors.
- Reels posted with trending audio enjoy a 45% higher reach than those without.
- Save and share metrics now contribute more to algorithmic visibility than likes.
- Hashtag stuffing (more than 10) results in a drop in reach by 18%, according to platform tests.
- Content with meaningful captions (over 140 characters) performs 21% better in engagement than short captions.
- Algorithm updates in 2025 reward consistent posting schedules, with the best frequency being 3–4 posts per week.
- Cross-posted content from other platforms like TikTok may be deprioritized, especially if it contains watermarks.
- AI-generated image and video content is now flagged and tagged, which can affect visibility if not properly disclosed.
- Engagement within the first 30 minutes of posting influences reach significantly—accounts with loyal audiences benefit most.
- Instagram now factors in time spent on posts as an engagement metric, especially for video and carousel formats.
Mobile Usage and App Download Rankings
- Instagram was the #2 most downloaded app in the US in Q1 2025, following TikTok.
- 93% of Instagram access happens via smartphones, with tablets making up just 4%.
- The Android version of the app has been downloaded over 1.8 billion times globally.
- On iOS, Instagram ranks in the top 3 for social networking apps across 58 countries.
- Instagram Lite, optimized for low-bandwidth environments, saw a 36% increase in downloads in 2024–25.
- In-app activity is heaviest between 6 PM and 10 PM local time, especially on weekends.
- Android users spend slightly more time per session—36 minutes vs. 31 minutes on iOS.
- Mobile notifications from Instagram have a 41% open rate, led by mentions and story replies.
- Over 40% of users access Instagram via mobile data, highlighting its appeal in on-the-go usage.
- The average user opens the app 7.2 times per day, most often to check notifications and view Stories.
Security, Privacy, and User Behavior Trends
- In 2025, 58% of users have enabled two-factor authentication, up from 46% in 2023.
- Instagram removes over 1.2 million fake accounts daily, part of a continued crackdown on spam and bots.
- 30% of users have set their profile to private, citing privacy and targeted ads as top concerns.
- The platform’s Sensitive Content Control is now enabled by default for users under 18.
- Instagram’s report-to-action time improved by 22%, with most abuse reports processed in under 12 hours.
- AI-driven moderation tools now identify 92% of policy violations before they’re reported.
- In 2025, users reported a 17% increase in harassment-related DMs, prompting stricter DM controls and filtering.
- Data portability features now allow users to export full archives in less than 15 minutes.
- Time-limit tools are used by 26% of Gen Z, up from 19% in 2024, reflecting growing digital mindfulness.
- The most blocked feature? DM requests from unknown accounts, with over 900 million blocks logged monthly.
Recent Developments
- Instagram launched a new “Creator Studio” toolset for influencers in February 2025, integrating analytics, scheduling, and collaboration tools.
- AI-generated content tags became mandatory for branded or synthetic media to promote transparency.
- A new “Ad-Free” subscription tier is in beta testing in the EU, with a starting price of €9.99/month.
- Threads integration is now native, allowing for easy cross-posting between both Meta platforms.
- Instagram began testing group Story features, enabling multiple users to collaborate on one Story thread.
- The platform introduced “Collaborative Reels”, allowing up to three creators to co-author a Reel.
- New shopping AI tools allow brands to generate personalized product recommendations via DM.
- A revamped Explore feed now includes location-based suggestions and AR previews for featured products.
- Instagram continues rolling out augmented reality filters designed for digital fashion try-ons and makeup previews.
- Meta announced that Instagram will play a major role in its new metaverse strategy, which is focused on immersive content and creator monetization.
Conclusion
Instagram in 2025 is more than a photo-sharing app—it’s a digital universe where culture, commerce, and creativity collide. With over 2.6 billion users, innovative features like Reels, and a booming e-commerce arm, the platform remains a cornerstone of the global social media landscape. Brands, creators, and casual users alike are finding new ways to connect and thrive.
Understanding the latest Instagram statistics isn’t just about data—it’s about insight. And if there’s one thing these numbers tell us, it’s this: Instagram continues to evolve, adapt, and influence how we communicate in the modern world.
Sources
- https://backlinko.com/instagram-users
- https://www.statista.com/topics/1882/instagram/
- https://electroiq.com/stats/instagram-statistics/
- https://www.businessofapps.com/data/instagram-statistics/
- https://www.statista.com/statistics/325587/instagram-global-age-group/
- https://thesocialshepherd.com/blog/instagram-statistics
- https://datareportal.com/essential-instagram-stats
- https://blog.hootsuite.com/instagram-statistics/


