WHAT WE HAVE ON THIS PAGE
- Editor’s Choice
- Web Design Spending Trends Among Businesses
- Total Number of Active Websites Worldwide
- Website Traffic and Visitors
- Do Businesses Believe a Website is Essential?
- Global Internet Usage and Website Access Trends
- Most Visited Websites in 2025
- Most Popular Domain Extensions by Registrations
- Mobile Website
- Website Traffic by Industry and Sector
- Breakdown of Website Traffic Sources
- Regional Distribution of Website Traffic
- Website Hosting, Platform, and Browser
- Google Chrome’s Global Web Traffic Share (2014–2024)
- Website Performance and Speed
- Website Engagement and Conversion
- How AI Is Being Used in Web Design
- Website SEO and Optimization
- Search Engine Traffic and SEO Statistics
- Website Load Time and Performance Benchmarks
- eCommerce Website
- Website Security and Downtime
- Countries With the Highest Number of Websites Worldwide
- User Behavior and Website Engagement Metrics
- Bounce Rates and Session Duration Trends
- Impact of AI on Website Personalization and Performance
- Recent Developments
- Conclusion
- Sources
In the early days of the internet, websites were digital postcards — static, text-heavy, and often hard to navigate. Fast forward to 2025, and they’ve become the nerve centers of global communication, commerce, education, and innovation. Whether you’re launching a startup, optimizing your digital storefront, or just curious about how the web works today, understanding current website statistics helps decode the digital behaviors shaping our world.
Let’s dive into the numbers behind how the internet will operate in 2025 — who’s online, where they’re visiting, and what it means for businesses and users alike.
Editor’s Choice
- As of 2025, the total number of active websites worldwide has reached over 1.13 billion.
- Google.com continues to be the most visited website, drawing 92.5 billion visits monthly.
- Mobile devices now account for over 61% of global website traffic, compared to 55% in 2023.
- The average website bounce rate stands at 50.7%, with session durations averaging 2 minutes and 35 seconds.
- The US alone has over 278 million internet users, contributing significantly to global website traffic.
- E-commerce websites now make up 26% of the world’s most visited domains.
- Websites optimized for mobile experience 48% higher engagement rates than non-optimized counterparts.
Web Design Spending Trends Among Businesses
- High-end budgets like $25,001–$50,000 are used by 2.5% of businesses.
- The most common spending range is $2,501–$5,000, chosen by 19.7% of businesses.
- 18.9% of businesses spend $501–$1,000 on web design annually.
- 13.9% fall into the $1,001–$2,500 bracket.
- 9.0% of businesses allocate $5,001–$10,000 yearly.
- 8.2% spend between $10,001–$25,000.
- Only 5.7% spend as little as $1–$100 on web design.
- 4.1% of businesses invest more than $200,000 per year.
- Mid-to-high spending ranges like $50,001–$100,000 (4.1%) and $100,001–$150,000 (4.9%) are less common.
- Just 1.6% of businesses report spending $150,001–$200,000.
- Smaller investments like $101–$500 account for 7.4% of responses.

Total Number of Active Websites Worldwide
- As of Q1 2025, the total number of active websites worldwide stands at 1.13 billion, up from 1.08 billion in 2024.
- 43.2% of all websites are powered by WordPress, solidifying its dominance among CMS platforms.
- Around 252,000 new websites are created every day, reflecting a steady growth trend.
- Only 18% of registered websites are currently active, with the rest parked or inactive.
- The United States, China, and Germany lead the world in the total number of active domains.
- There are over 220 million domain name registrations under the .com TLD alone.
- The .xyz domain has seen a 12% year-over-year increase in new registrations, largely driven by Web3 startups.
Website Traffic and Visitors
- The average number of monthly website visits per site globally is 6,000, with sharp variances depending on niche and content.
- In 2025, organic search accounts for 53.1% of website traffic, while direct traffic holds a 21.3% share.
- Social media referral traffic contributes 9.4% to overall website visits.
- Desktop devices contribute 39% of global website visits despite mobile dominance.
- An average visitor views 3.4 pages per session, slightly up from 3.1 in 2024.
- The bounce rate for blog websites remains highest at 63.2%, while financial services maintain the lowest at 34.7%.
- Peak website traffic globally occurs between 7 PM and 10 PM local time across most regions.
Do Businesses Believe a Website is Essential?
- Only 9% of respondents disagree, believing a website may not be necessary for a business.
- A strong 69% of respondents agree that having a website is essential for a business.
- 22% of people neither agree nor disagree, showing some neutrality or uncertainty.

Global Internet Usage and Website Access Trends
- The number of global internet users surpassed 5.5 billion in early 2025, accounting for 68.8% of the world’s population.
- Internet penetration in North America stands at 93.1%, the highest by region.
- Africa recorded the largest year-over-year internet adoption rate increase at +10.3%.
- The global average time spent online per day is 6 hours and 45 minutes.
- Smart TVs and IoT devices now account for 7% of total web access points.
- Over 4.1 billion people access the internet through mobile devices alone.
- The number of people using voice search for browsing websites has increased by 22% year-over-year.
Most Visited Websites in 2025
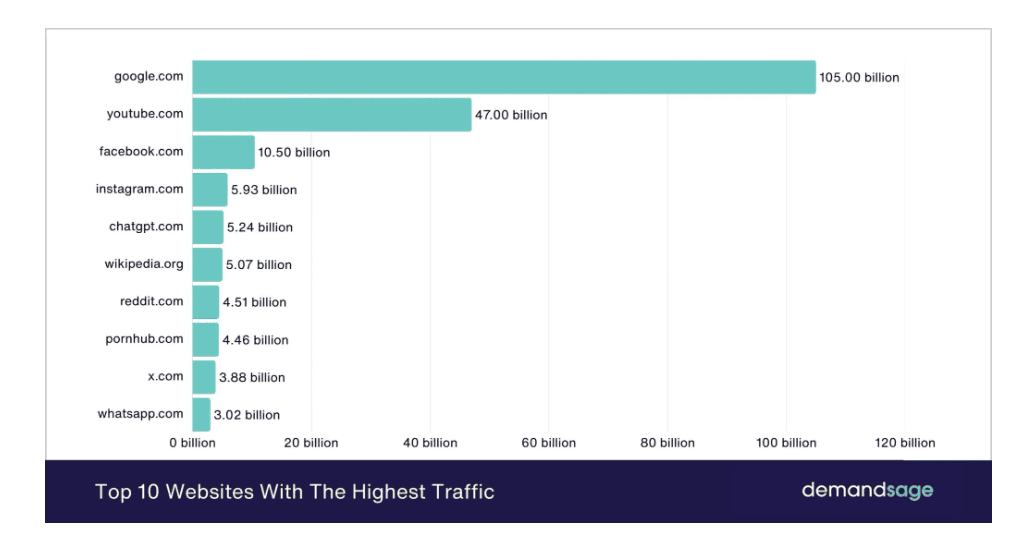
- Google.com leads all websites with 92.5 billion monthly visits, followed by YouTube with 83.7 billion.
- Facebook ranks third, drawing 41.2 billion monthly visits, primarily from mobile devices.
- Amazon leads in the eCommerce space with 3.3 billion monthly visits, dominating global retail.
- Wikipedia attracts 1.8 billion monthly visits, cementing its place as the web’s encyclopedia.
- Twitter (now X) sees around 1.1 billion monthly visits, with heavy traction in political and news cycles.
- Reddit has seen a traffic boost to 970 million monthly visits, especially among users aged 18–29.
- Streaming sites like Netflix and Twitch together account for 7.4 billion monthly visits.
- Instagram.com is now accessed more through mobile browsers than desktop by a margin of 72%.
- US-based websites make up 61% of the top 100 most visited domains globally.
Most Popular Domain Extensions by Registrations
- .com is the most popular domain extension with 160.5 million registrations. It significantly outpaces all other TLDs in global usage.
- .cn (China) has 18.0 million registered domains. It leads among country-specific TLDs after .com.
- .de (Germany) holds 17.4 million domains. It’s the most used TLD in Europe.
- .net has a total of 13.2 million domain registrations. Once a top choice, it’s now surpassed by several regional domains.
- .uk (UK) accounts for 11.1 million domains. It’s the second most popular European TLD.
- .org has 10.7 million domains. It’s commonly used by non-profit and open-source organizations.
- .nl (Netherlands) has 6.3 million domain registrations. It’s one of the most adopted TLDs for a small country.
- .ru (Russia) stands at 5.6 million domains. It represents the largest domain usage in Eastern Europe.
- .br (Brazil) has reached 5.0 million domain registrations. It leads in domain usage in South America.
- .au (Australia) rounds out the list with 4.2 million domains. It reflects steady adoption in the Oceania region.

Mobile Website
- Mobile devices contribute 61.6% of global website traffic as of Q1 2025, up from 58.3% in 2024.
- 85% of users say a poor mobile website experience makes them less likely to return.
- Websites optimized for mobile load 1.8 seconds faster than non-optimized sites.
- Google reports that mobile-first indexing now affects 99% of all websites indexed.
- Bounce rates on mobile average 54%, slightly higher than desktop at 47%.
- The average mobile page session is 2 minutes and 4 seconds, indicating stronger engagement than before.
- Progressive Web Apps (PWAs) are used by 12% of top e-commerce sites to improve the mobile experience.
- Mobile-friendly sites see 24% higher conversion rates compared to those lacking optimization.
Website Traffic by Industry and Sector
- Retail websites lead in global traffic by sector, capturing 23.7% of all web visits in 2025.
- The media and entertainment industry sees an average of 12.1 million monthly visits per site, driven by streaming and news platforms.
- Finance websites have an average bounce rate of just 34.7%, the lowest among major industries.
- The education sector saw a 9.4% increase in web traffic year-over-year, largely fueled by online learning platforms.
- Healthcare websites record 6.3 million monthly visits on average, with peak traffic during flu and allergy seasons.
- The SaaS industry experienced a 19.2% growth in website traffic compared to 2024, with demand surging for AI-driven tools.
- Travel and hospitality websites have rebounded post-pandemic, seeing a 14.5% YoY increase in traffic in Q1 2025.
- Government and public service websites experienced a spike in visits around elections and tax season, peaking at 11.8 million visits/month.
- Legal service websites saw a 27% increase in mobile traffic year-over-year, signaling a shift in user behavior.
- Automotive websites, including EV platforms, attracted 8.4 million monthly visits, up from 7.2 million in 2024.
- Sports media websites spiked during major events, accounting for 6.9% of all internet traffic during peak weeks.
Breakdown of Website Traffic Sources
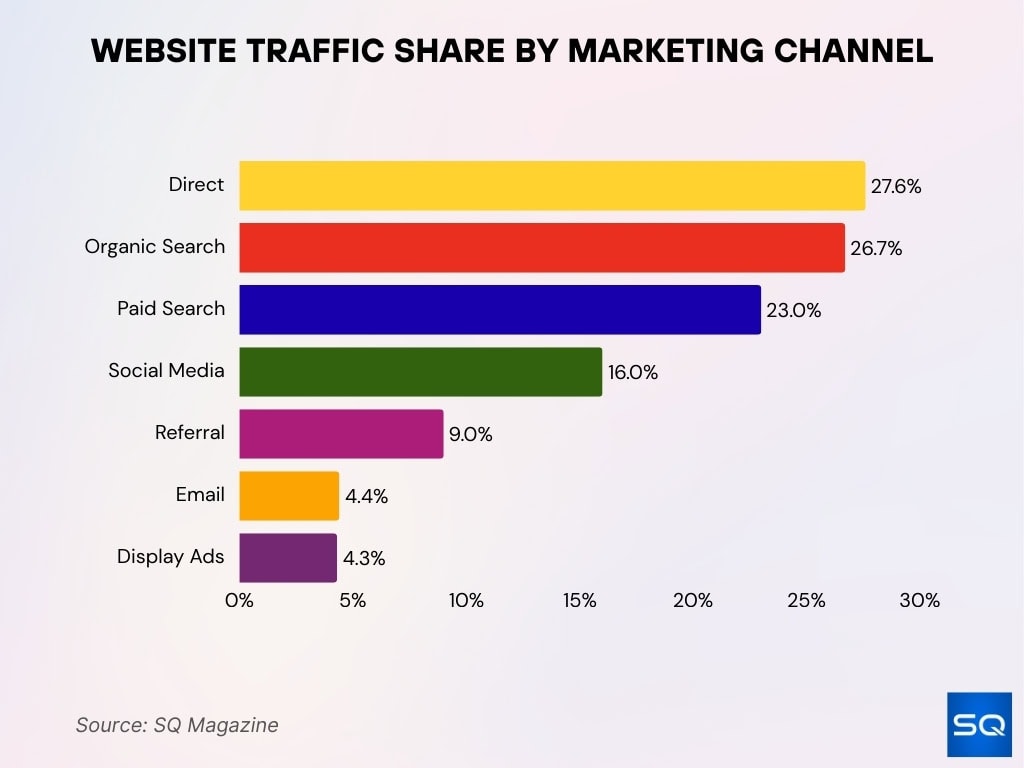
- Other sources are minimal, totaling just 1%. These could include offline campaigns or less common digital paths.
- Direct traffic leads the way, accounting for 22% of all website visits. This includes users typing URLs directly or using bookmarks.
- Organic Search brings in 17% of traffic. It highlights the importance of SEO and search visibility.
- Social media platforms contribute 16% of traffic. This reflects strong engagement from networks like Facebook, Twitter, and Instagram.
- Email campaigns generate 14% of traffic. A solid email marketing strategy still plays a vital role in user acquisition.
- Display ads account for 12% of traffic. Banner and visual ads continue to drive significant clicks.
- Referral traffic makes up 9%. These visitors arrive via links from other websites.
- Paid search also contributes 9%. This includes traffic from paid ad placements on search engines.

Regional Distribution of Website Traffic
- North America remains the largest consumer of web content, contributing 33.1% of total website traffic.
- Asia-Pacific now accounts for 41.6% of global website visits, with India and China leading the charge.
- Europe contributes 18.4% of website traffic, showing stable year-over-year performance.
- Africa’s web traffic share has grown to 4.8%, largely due to increased mobile penetration.
- In Latin America, Brazil alone accounts for 52.7% of the region’s web traffic volume.
- South Korea and Japan have the highest average page views per session globally: 5.1 pages and 4.9 pages, respectively.
- The Middle East has seen a 13.7% increase in mobile-driven web traffic, especially in the UAE and Saudi Arabia.
- US-based websites receive 66% of their traffic from domestic users and 34% from international audiences.
- Germany, the UK, and France collectively make up 65% of Europe’s total web usage.
- Localized content websites see 2.3x higher engagement in regional markets than non-localized counterparts.
Website Hosting, Platform, and Browser
- GoDaddy leads in hosting market share with 8.7%, followed closely by Bluehost (6.4%) and HostGator (5.9%).
- Cloudflare now protects and speeds up 19 million+ websites, including 16.3% of top-ranked sites globally.
- WordPress powers 43.2% of all websites, retaining the top spot among CMS platforms.
- Shopify, geared toward eCommerce, supports over 4.6 million active websites, a 15% increase from last year.
- Wix hosts 250 million websites globally, with a noticeable boost in SMB usage.
- Chrome remains the most popular browser, used by 65.3% of global internet users.
- Safari comes second at 18.2%, with Microsoft Edge holding 5.1% of the market share.
- Mobile Safari accounts for 53% of iOS traffic, dominating mobile browsing in the Apple ecosystem.
- The average website is hosted on a shared hosting plan, though cloud hosting adoption rose by 11.4% YoY.
- Over 70% of websites now use HTTPS, improving user trust and SEO performance.
- By Dec 2024, Chrome’s traffic share reached 68.34%, with a +5.6% increase YoY.
- In Dec 2014, Chrome held 40.93% of global web traffic share.
- By Dec 2015, that share grew to 47.14%, a +15% relative increase.
- Dec 2016 saw Chrome hit 51.06%, growing by +8.3% from the previous year.
- Chrome’s share rose to 55.04% in Dec 2017, marking a +7.8% increase.
- A major jump came in Dec 2018, reaching 62.28%, a +13% surge.
- In Dec 2019, Chrome hit 63.62%, with a modest +2.2% increase.
- By Dec 2020, Chrome’s share slightly dropped to 63.38%, down -0.4%.
- Dec 2021 showed a small recovery to 63.80%, a +0.7% rise.
- In Dec 2022, usage climbed to 64.68%, reflecting a +1.4% gain.
- Chrome’s share held steady at 64.70% in Dec 2023, showing a 0.0% change.

Website Performance and Speed
- The average website load time globally is 2.8 seconds, with top-performing sites loading in under 1.7 seconds.
- 40% of users abandon a website if it takes longer than 3 seconds to load.
- Google’s Core Web Vitals performance shows that only 36.4% of mobile sites meet all three benchmarks.
- Sites that load in under 2 seconds convert at a rate 2.3x higher than slower-loading pages.
- The use of lazy-loading images has improved performance scores by 28% on average.
- CDN usage has expanded to 72% of global websites, up from 65% in 2023.
- Optimized websites report a 16% drop in bounce rates due to faster speeds.
- AMP (Accelerated Mobile Pages) adoption is declining, down 18% YoY, as sites favor responsive design.
- Video-heavy landing pages see a 31% increase in load time unless optimized with adaptive streaming.
- Image compression using WebP and AVIF formats can reduce image sizes by 35%–50%, without sacrificing quality.
Website Engagement and Conversion
- The average website conversion rate across industries is 2.35%, with the best performers achieving over 5.3%.
- B2B websites convert at an average rate of 2.1%, while e-commerce hits 2.9% on desktops.
- Exit-intent popups can increase conversions by 11%, particularly on high-bounce pages.
- Live chat integrations improve engagement metrics, boosting time-on-site by 24% on average.
- Pages with clear CTA buttons convert 3.6x better than those without actionable prompts.
- Long-form content pages (over 2,000 words) generate 52% more leads than shorter pages.
- Interactive elements like quizzes and calculators can lift conversion rates by 18% or more.
- Personalization strategies — like dynamic content blocks — drive a 23% increase in user interaction.
- Landing pages optimized for A/B testing see 20% higher ROI compared to static ones.
- Websites with consistent font styling and mobile-friendly layouts convert 30% better than cluttered, inconsistent designs.
How AI Is Being Used in Web Design
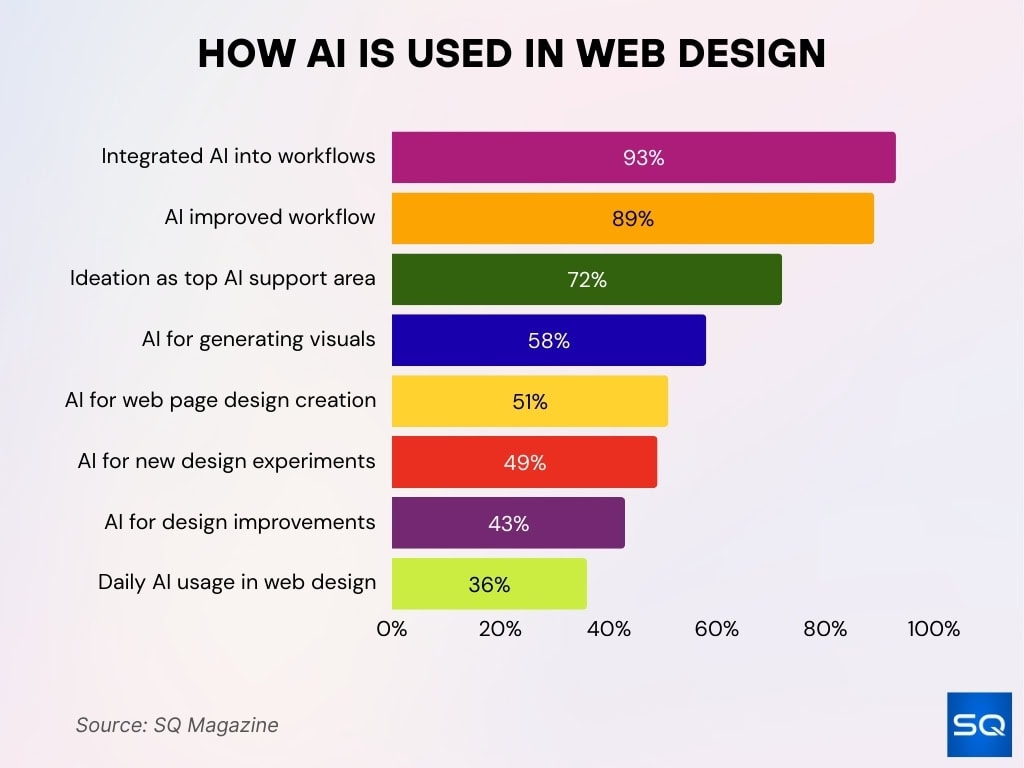
- 43% apply AI to improve design quality. It supports enhancements in visual consistency, responsiveness, and usability.
- 58% of designers use AI for generating imagery. This is the most common application, showcasing AI’s strength in visual creativity.
- 50% of respondents use AI to create complete web designs. This indicates growing trust in AI’s ability to handle full design workflows.
- 49% use AI for experimenting with new design strategies. AI is helping teams test innovative layouts and user experiences.

Website SEO and Optimization
- SEO drives 53.1% of total website traffic globally, making it the most powerful inbound channel.
- Keyword optimization in H1 and title tags improves rankings by 45% compared to content without them.
- Sites with faster load times are 1.9x more likely to appear in the top 10 Google search results.
- Structured data (schema markup) boosts click-through rates by 14.2% in search listings.
- Mobile-first indexing affects 99% of ranked websites, making mobile optimization crucial for SEO.
- Internal linking increases average session duration by 40%, enhancing page authority and crawlability.
- Pages with video content are 53 times more likely to appear on the first page of Google.
- The top-ranking pages typically have an average word count of 1,890 words.
- User-generated content (e.g., reviews and comments) can improve SEO rankings by 23% on product pages.
- Meta descriptions under 155 characters improve mobile CTR by 19% over longer versions.
Search Engine Traffic and SEO Statistics
- Google holds 91.6% of the global search engine market share as of 2025.
- Bing accounts for 3.3%, followed by Yahoo at 1.3%, and DuckDuckGo at 0.9%.
- Organic search contributes to 67% of all trackable web traffic on average.
- Pages in the top 3 search results get 68.7% of all clicks.
- Sites that update content at least once every 3 months rank 30% higher than stagnant competitors.
- Voice search optimization has grown in importance, with 32% of US adults using voice assistants to search the web.
- Local SEO drives 42% of total searches with “near me” queries up 17% YoY.
- Image-based search tools, such as Google Lens, now influence 9.5% of mobile search traffic.
- Only 0.63% of Google searchers click on results from the second page.
- SEO-optimized blog posts generate 3.1x more traffic than non-optimized counterparts.
Website Load Time and Performance Benchmarks
- Top-performing websites load in under 1.7 seconds on desktop and 2.1 seconds on mobile.
- Websites that load within 2 seconds have an average bounce rate of 9%, compared to 38% at 5 seconds.

- Every additional second of load time can reduce conversions by 4.4%.
- Google’s PageSpeed Insights recommends a score of 90+ for optimal UX and SEO benefits.
- Third-party scripts, including ad networks and widgets, slow load time by 1.2 seconds on average.
- Sites using lazy loading for images and videos reduce initial page load by up to 35%.
- WebP images load 25–35% faster than JPEGs and PNGs without quality loss.
- Performance-focused websites have 30% higher mobile engagement rates than average.
- Pages optimized for Core Web Vitals outperform peers by 22% in user satisfaction scores.
- Businesses using performance monitoring tools like Lighthouse or GTmetrix report 18% fewer complaints regarding page slowness.
eCommerce Website
- In 2025, e-commerce websites accounted for 26% of the top 1,000 most-visited domains globally.
- Global e-commerce sales are projected to reach $6.5 trillion, up from $5.8 trillion in 2024.
- The average conversion rate for eCommerce websites is 2.9%, with desktop outperforming mobile.
- Cart abandonment rates remain high at 69.8% but drop to 55% with optimized checkout flows.
- Mobile commerce (mCommerce) is now responsible for 62% of online purchases globally.
- Product pages with video content see a 37% higher conversion rate than those with only images.
- eCommerce websites that offer free shipping increase conversion by an average of 32%.
- AI-powered product recommendations can drive 29% of total eCommerce revenue.
- Sites with one-click checkout features report 21% faster transaction completion.
- Personalized email campaigns lead to 17% more repeat purchases on eCommerce platforms.
Website Security and Downtime
- As of 2025, 73% of websites use SSL certificates, up from 68% in 2024.
- The average cost of a data breach involving a website is $4.45 million, according to recent reports.
- DDoS attacks increased by 18% year-over-year, with e-commerce sites being prime targets.
- 48% of users say they would abandon a purchase if a website lacks clear security indicators (HTTPS, padlock).
- WordPress sites without proper security plugins are 2.6x more likely to be hacked.
- Downtime incidents due to cyberattacks rose by 21%, averaging 3.2 hours per attack.
- Websites with multi-factor authentication enabled are 47% less vulnerable to unauthorized logins.
- Healthcare and finance sectors experience the longest average downtimes: 7.8 hours per incident.
- Bot traffic now represents 42.3% of all website activity — a key concern for analytics accuracy and fraud detection.
- 59% of small business websites remain vulnerable due to outdated CMS versions or weak passwords.
Countries With the Highest Number of Websites Worldwide
- United States: 146 million websites — by far the global leader in website count.
- Iceland: 22 million websites — a surprisingly high number given its small population.
- China: 19 million websites — a strong presence reflecting its vast internet user base.
- Canada: 10 million websites — a notable contribution from North America.
- France: 9 million websites — reflecting strong European web activity.
- Germany: 8.5 million websites — consistent with its tech-savvy reputation.
- Japan: 8 million websites — a major player in Asia’s digital landscape.
- United Kingdom: 7.5 million websites — demonstrating continued digital engagement.
- Netherlands: 6.5 million websites — impressive numbers for a smaller country.

User Behavior and Website Engagement Metrics
- The average session duration across all websites was 2 minutes and 35 seconds in 2025.
- Users typically visit 3.4 pages per session, with higher counts seen on news and shopping sites.
- Scroll depth averages 62%, meaning most visitors don’t reach the bottom of the page.
- Websites with interactive content (e.g., sliders, polls) have 41% longer session durations.
- The average user clicks 1.7 links per visit, showing selective on-site engagement.
- Return visitor rates are highest in SaaS and news sites, averaging 42.5%.
- Articles with embedded video see 2.6x more time on page than text-only content.
- Adding social sharing buttons increases content visibility and time on site by 15%.
- Dark mode and minimalist design trends are improving engagement among Gen Z users.
- Gamified user experiences (e.g., quizzes, progress bars) can boost engagement metrics by 22%.
Bounce Rates and Session Duration Trends
- The average bounce rate across all industries is 50.7%, down slightly from 51.4% in 2024.
- Blogs and recipe sites have the highest bounce rates, averaging 63%.
- B2B service sites report the lowest bounce rates, typically 35–39%.
- Mobile users tend to bounce faster than desktop users, with rates of 54% and 46%, respectively.
- Sites with fast-loading, mobile-optimized landing pages experience 12% lower bounce rates.
- Pages using embedded forms above the fold have lower bounce rates by 9%.
- Session durations are longest on educational and research sites, averaging 4 minutes and 15 seconds.
- E-commerce session times have increased to 2 minutes and 41 seconds, driven by improved navigation and personalization.
- Bounce rates are 16% lower on sites using heatmap-based design improvements.
- Exit rates drop by 11% when internal linking is improved through related content widgets.
Impact of AI on Website Personalization and Performance
- 61% of websites now use AI-driven tools for personalization, content creation, or user targeting.
- AI personalization can increase conversions by up to 34%, especially in e-commerce and SaaS.
- Chatbots are present on 41% of websites, handling basic inquiries and improving lead capture rates.
- AI-powered search bars deliver 3.5x more accurate results, enhancing on-site navigation.
- Content generation using AI tools has reduced blog production costs by 27% on average.
- Recommendation engines driven by machine learning account for 29% of e-commerce site revenue.
- Predictive analytics tools are helping B2B marketers increase lead quality by 31%.
- AI-generated AB testing speeds up optimization cycles, cutting testing time by 35%.
- Voice assistants on websites (e.g., for accessibility) are increasing user satisfaction scores by 19%.
- AI also enables real-time performance monitoring, leading to a 28% reduction in critical errors.
Recent Developments
- In Q1 2025, Google introduced updates to its Search Generative Experience (SGE), emphasizing AI-first search results.
- The W3C announced new accessibility guidelines set to go into effect by late 2025.
- Shopify introduced Hydrogen 3.0, improving load speeds and backend flexibility for e-commerce sites.
- Microsoft Edge now supports native AI page summarization, boosting session time on supported websites.
- Web3 domains (.eth, .crypto) gained popularity, with over 950,000 active Web3 websites now indexed.
- Adobe launched a beta for AI-driven UX personalization aimed at enterprise-level web applications.
- Apple Safari 18 introduces Private Click Measurement 2.0, impacting ad attribution methods.
- TikTok has begun testing in-app website experiences, allowing creators to embed full browsing features.
- Wix and Squarespace both rolled out AI design assistants to auto-generate personalized templates.
- Webflow announced its integration with AI-driven code generation, helping designers skip manual front-end coding.
Conclusion
The internet in 2025 will not just be bigger — it will be smarter, faster, and more personalized than ever. From AI-generated content to region-specific optimization, websites today are living platforms, adapting constantly to user needs and expectations. Mobile-first design, real-time personalization, and SEO are no longer optional — they’re foundational. For brands, publishers, and creators, staying relevant means staying agile. The data is clear: those who prioritize performance, experience, and trust will shape the next phase of the web.
Sources
- https://www.digitalsilk.com/digital-trends/top-website-statistics/
- https://diviflash.com/website-statistics/
- https://www.weebly.com/websites/statistics
- https://www.polemicdigital.com/basic-explanation-of-web-statistics
- https://www.statista.com/topics/12081/top-websites-worldwide/
- https://learn.g2.com/website-statistics
- https://www.coolest-gadgets.com/website-statistics/
- https://milkandtweed.com/blog/7-statistics-you-need-to-know-about-your-website/
ABOUT AUTHOR