When Emma launched her direct-to-consumer skincare brand, she thought a strong website would do the trick. But soon, her traffic stagnated, and sales didn’t budge. Then she tried something different: mobile marketing. Within six months, mobile-driven traffic doubled, and over 60% of conversions came from phones.
Her story isn’t unique.
In 2025, mobile isn’t just a screen; it’s the storefront, the billboard, and the checkout counter. From advertising budgets to how consumers behave in real time, the mobile-first approach isn’t optional anymore. This article breaks down the most relevant statistics, so you can understand where the mobile marketing landscape stands right now and where it’s heading.
Editor’s Choice
- $533 billion: Global mobile advertising spend is projected to reach $533 billion in 2025, growing 12.3% year-over-year.
- 72.8%: 72.8% of total digital ad spend now comes from mobile devices.
- 89%: 89% of consumers say they are more likely to recommend a brand that offers a seamless mobile experience.
- 61%: 61% of all retail website traffic in 2025 originates from smartphones.
- 77%: 77% of marketers say mobile is their top channel for driving engagement.
- 34 minutes: Average daily time spent on mobile video ads increased to 34 minutes globally.
- 3.3 billion: 3.3 billion people will shop using mobile commerce platforms by the end of 2025.
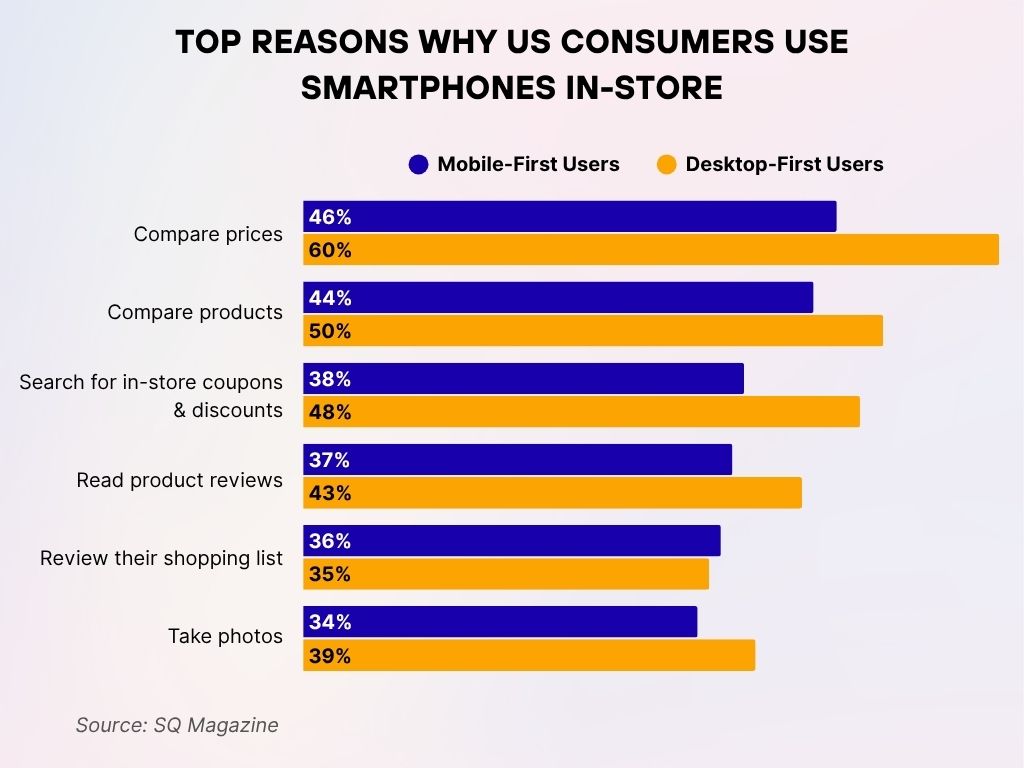
Top Reasons Why US Consumers Use Smartphones In-Store
- Comparing prices is the top reason, with 60% of Desktop-First Users and 46% of Mobile-First Users doing so while shopping.
- 50% of Desktop-First Users and 44% of Mobile-First Users use their phones to compare products in-store.
- Search for in-store coupons & discounts is done by 48% of Desktop-First Users compared to 38% of Mobile-First Users.
- Reading product reviews is a habit for 43% of Desktop-First Users and 37% of Mobile-First Users.
- 36% of Mobile-First Users and 35% of Desktop-First Users check or review their shopping list on their phone while in-store.
- Taking photos while shopping is done by 39% of Desktop-First Users versus 34% of Mobile-First Users.
Global Mobile Marketing Spend Trends
- $533 billion is the estimated global mobile ad spend in 2025.
- 12.3% annual growth rate marks mobile as the fastest-growing digital advertising category in 2025.
- Asia-Pacific leads regional spending with $231 billion, followed by North America at $164 billion.
- 41% of total global marketing budgets are now allocated to mobile.
- 60% of mobile spend in 2025 is targeted toward social and in-app placements.
- 59% of brands increased their mobile ad budgets in Q1 2025 alone.
- $34.2 billion is expected to be spent on location-based mobile marketing this year.
- 6.2x: Mobile marketing budgets are now 6.2x higher than desktop budgets, a trend reversing the early-2010s ratio.
- 45% of CMO survey respondents ranked mobile marketing as their #1 strategic priority in 2025.
- 92% of enterprise-level marketers plan to increase mobile ad investments before year-end.
Mobile Advertising Spending
- 72.8% of all digital advertising dollars in 2025 are allocated to mobile platforms.
- In-app ads account for 64% of mobile advertising expenditures in 2025.
- $86 billion is spent on mobile search ads, surpassing desktop search for the first time.
- 54% of B2C marketers say their highest ROI campaign in 2025 came from mobile ads.
- $52.6 billion is being spent globally on mobile video advertising.
- 38% of mobile ads now use dynamic creative optimization for real-time personalization.
- Retail and e-commerce industries contribute 26% of global mobile ad spend.
- 43% of advertisers are using programmatic buying exclusively for mobile channels.
- 14.7% of mobile ad impressions are now shoppable ads, allowing direct product purchases.
- 3.9% of mobile ad budget is spent on augmented reality formats.
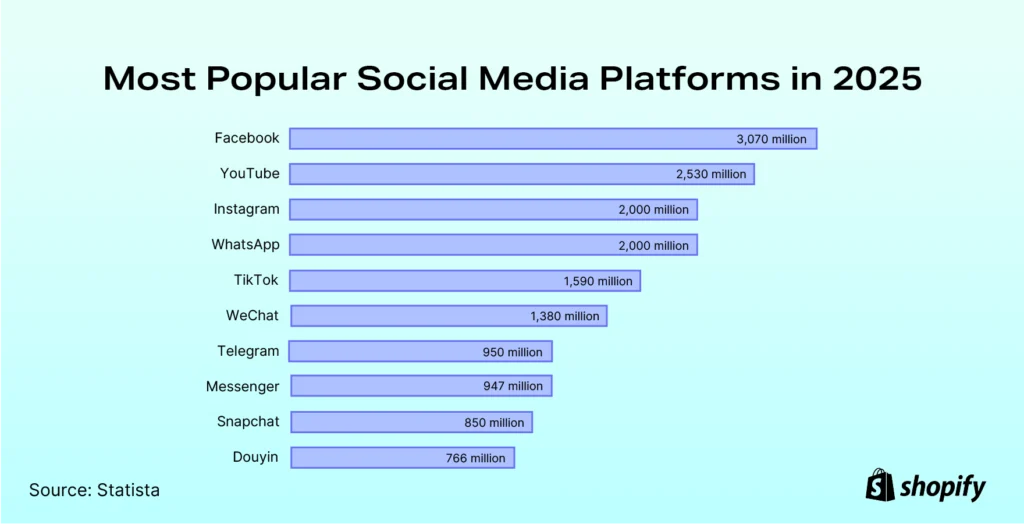
Most Popular Social Media Platforms
- Facebook leads with a massive 3,070 million users globally.
- YouTube secures second place, attracting 2,530 million users.
- Both Instagram and WhatsApp share 2,000 million active users each.
- TikTok continues its growth with 1,590 million users worldwide.
- WeChat maintains strong numbers, reaching 1,380 million users.
- Telegram has grown to 950 million users in 2025.
- Messenger closely follows with 947 million active users.
- Snapchat holds a steady audience of 850 million users.
- Douyin, TikTok’s Chinese counterpart, reaches 766 million users.
Consumer Behavior on Mobile Devices
- 61% of retail web visits in 2025 come from mobile devices.
- 49% of online shoppers make purchases on mobile-first, never switching to desktop.
- 37% of users say they would abandon a brand entirely if its mobile site is slow or clunky.
- 3.3 billion consumers globally will make at least one m-commerce transaction this year.
- 53% of people prefer to receive brand communication via SMS or mobile push, not email.
- 68% of Gen Z users discover products via social ads on mobile.
- 4.8 hours is the average daily time adults spend on their mobile devices in 2025.
- 42% of users research products on mobile while physically in a store.
- 81% of consumers use mobile devices during their shopping journey, even for big-ticket items.
- 35% of all food delivery orders are now made through branded mobile apps.
Mobile App Marketing
- $210 billion is projected app store consumer spending in 2025, with mobile games accounting for 60%.
- 71% of app marketers report higher lifetime value from users acquired via mobile campaigns.
- 42% of businesses now rely on apps as their primary digital channel.
- 7.6 million apps are available globally, and 70% of them are accessed via mobile-only.
- 56% of marketers say push notifications are their top-performing in-app feature in 2025.
- $26.4 billion is spent on user acquisition campaigns for mobile apps.
- 22% of mobile app installs are driven by social media ads, mainly on Instagram and TikTok.
- Retention rate after 30 days of install averages 17%, making onboarding optimization a key focus.
- 61% of app users allow location access, enabling stronger personalized experiences.
- 43% of marketers report using mobile deep linking to increase in-app engagement.
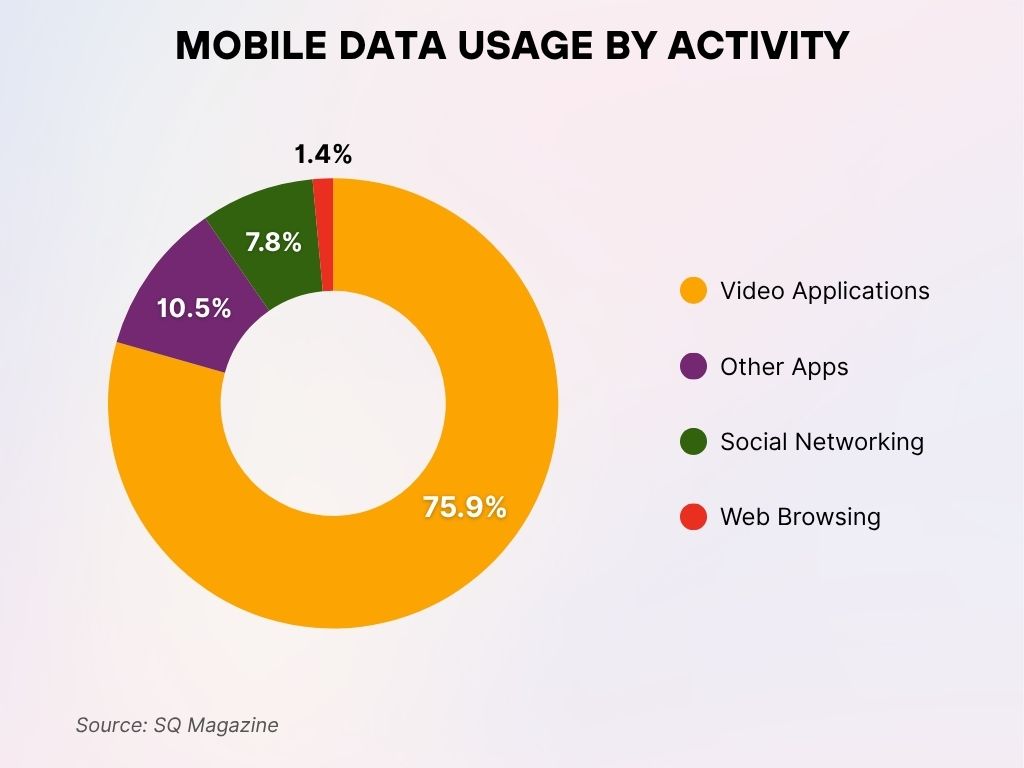
Mobile Data Usage by Activity
- Video applications dominate mobile traffic, accounting for a massive 75.9% of total data usage.
- Other apps consume 10.5% of mobile data, covering various non-video, non-social functions.
- Social networking apps use 7.8% of total mobile data, highlighting their continued relevance.
- Web browsing represents only 1.4% of mobile data usage, showing a major shift away from traditional internet use.
SMS and Push Notification Engagement Rates
- 56% of consumers say they are more likely to engage with brands that use SMS to communicate timely offers.
- 41% average open rate for promotional push notifications sent in 2025, compared to 21% for emails.
- 91% of mobile users read a text message within 3 minutes of receiving it.
- 28% average click-through rate (CTR) for rich media push notifications.
- 76% of businesses now use a combination of SMS and push for real-time customer engagement.
- $94 billion is spent globally on mobile messaging campaigns.
- 23% of mobile app uninstalls are caused by overuse of push notifications.
- 72% of consumers have opted into SMS updates from at least one retail brand.
- 47% of companies personalize push messages based on user behavior rather than demographics.
- 32% higher retention rates are observed in apps that use personalized push notifications.
Location-Based Mobile Marketing Data
- $34.2 billion is allocated globally to location-based marketing in 2025.
- 79% of marketers use geofencing to trigger app notifications when users enter a predefined area.
- 62% of consumers are willing to share location data for tailored offers.
- 91% of location-based messages lead to physical store visits within 24 hours.
- 26% of local search conversions happen within one hour of the search.
- 42% of businesses use beacon technology to engage mobile users in-store.
- 58% of shoppers use their smartphones to compare prices while inside physical stores.
- 13% of all mobile ad impressions are location-targeted in 2025.
- 67% of consumers expect brands to deliver contextual offers based on their current location.
- $9.4 billion in mobile ad revenue is directly attributed to geo-targeted advertising this year.
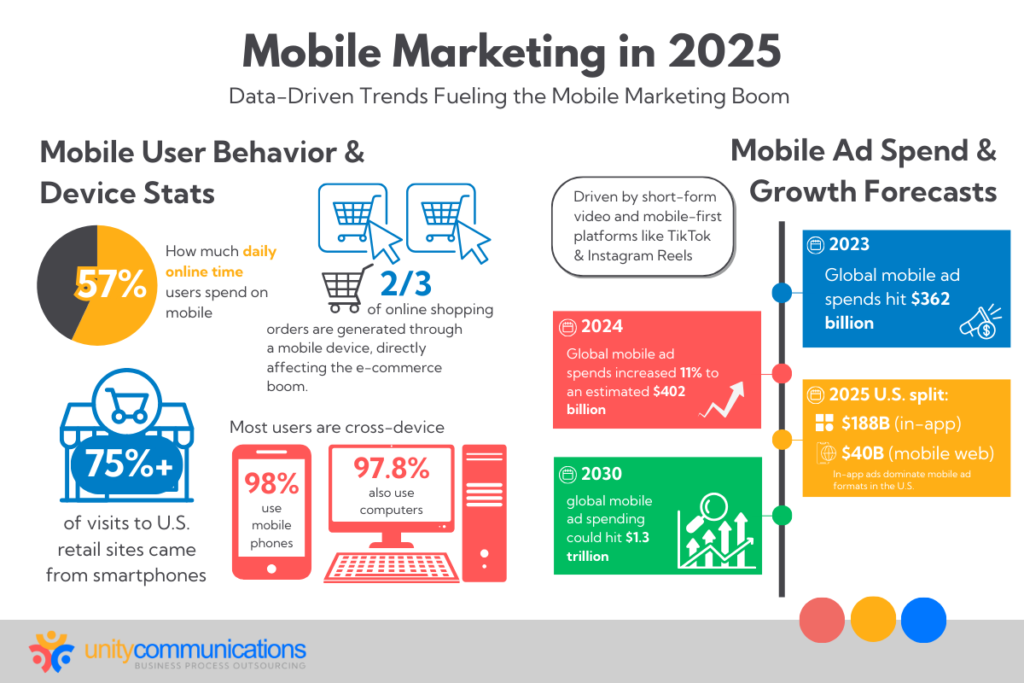
Mobile Marketing Key Stats & Spending Insights
- 57% of users’ daily online time is spent on mobile devices.
- 2 out of 3 online shopping orders are placed using a mobile device, driving the e-commerce boom.
- Over 75% of U.S. retail site visits now come from smartphones.
- 98% of users access content via mobile phones, while 97.8% also use computers, showing strong cross-device behavior.
- In 2023, global mobile ad spending reached $362 billion.
- In 2024, global mobile ad spend grew by 11%, hitting $402 billion.
- By 2030, global mobile ad spending is projected to hit $1.3 trillion.
- For 2025 in the U.S., mobile ad spend is split into $188B for in-app ads and $40B for mobile web ads, highlighting the dominance of in-app formats.
Mobile Search and Shopping
- 68% of all Google searches happen on mobile in 2025.
- 53% of shoppers abandon a site that takes more than 3 seconds to load on mobile.
- 34% of mobile searchers make a purchase within one hour of discovery.
- 41% of eCommerce revenue in the US comes from mobile purchases.
- 62% of users say they’re more likely to buy from brands with a mobile-friendly checkout.
- 27% of all voice searches are made using mobile assistants like Siri and Google Assistant.
- 89% of smartphone users turn to search engines to find information on a local business.
- $441 billion is the projected revenue from mobile shopping in the US by the end of 2025.
- 57% of shoppers use mobile devices in-store to look up product reviews and offers.
- 32% of cart abandonments are linked to poor mobile UX during checkout.
Video Marketing
- $52.6 billion is spent globally on mobile video ads in 2025.
- 34 minutes: the average daily time consumers spend watching video ads on mobile.
- 72% of marketers rate video as the most effective format for mobile engagement.
- 41% of consumers have purchased a product after watching a mobile video ad.
- 88% of videos shared on mobile are under 30 seconds, making short-form king.
- 54% of video content consumed in-app is brand-sponsored or product-focused.
- 47% of users say they’ve discovered new brands via video ads on social platforms.
- 6.4%: Average conversion rate for mobile video ads across industries.
- 23% of mobile video campaigns now use interactive elements, such as polls or AR.
- 82% of B2C companies report that mobile-first video has outperformed traditional formats.
Digital Advertising Share by Industry
- Retail leads the pack, claiming the largest share at 22.6% of all digital advertising spend.
- Financial Services comes in second with a significant 14.8% share.
- The Automotive industry holds 13.0%, reflecting its strong online presence.
- Consumer Packaged Goods accounts for 10.6% of total digital ad investments.
- The Travel sector captures 8.8%, driven by digital bookings and promotions.
- Telecom secures 8.0% of digital ad spend, maintaining strong marketing activity.
- Healthcare & Pharma contributes 7.3%, rising with health-related digital engagement.
- Tech follows closely with 6.5%, supporting product launches and services.
- Media & Entertainment holds 5.9%, driven by content streaming and promotions.
- Education lags with only 2.5%, showing a smaller digital advertising footprint.

Video Consumption via Mobile Platforms
- 91% of digital video views occur on smartphones or tablets.
- 38 hours/month: the average time Gen Z spends watching videos on mobile devices.
- 57% of all YouTube watch time now happen on mobile in 2025.
- 62% of mobile video viewers prefer vertical video formats.
- 76% of Facebook Watch content is consumed via mobile-only viewers.
- TikTok accounts for 33% of total mobile video consumption in the 18-24 age group.
- 60% of streaming subscribers use their phones to access platforms like Hulu and Netflix.
- 29% of users watch mobile video content while commuting, making public transit a key consumption moment.
- 74% of viewers say they watch branded video content to learn about new products.
- $11.2 billion is the mobile ad revenue expected from video-based influencer collaborations.
Mobile Email Marketing Performance
- 66% of emails are opened on mobile devices in 2025.
- 49% of mobile users check their email more than three times per day.
- 29%: The average click-to-open rate (CTOR) for mobile-optimized emails.
- 58% of email marketers say that mobile-responsive design directly improved their engagement metrics.
- 3.7 seconds: Average time a user spends scanning an email on mobile before deciding to read or delete it.
- 33% of cart recovery emails are now opened and clicked via smartphones.
- 82% of marketing teams now design emails mobile-first rather than desktop-first.
- 71% of consumers say they delete emails that don’t display correctly on mobile.
- 25.6%: Average revenue growth among businesses using automated mobile email sequences.
- $15.2 billion is forecasted global spend on mobile email marketing tools in 2025.
Top Challenges in Email Marketing Execution
- Poor coordination across departments is the top issue, affecting 16.4% of marketers.
- Insufficient staffing hampers effectiveness for 14.4% of teams.
- Limitations of current email service providers impact 14.1% of marketers.
- Bad strategy or leadership causes struggles for 12.8% of organizations.
- Lack of quality data and integration is a concern for 12.2% of email marketers.
- Inadequate tools for email creation affect 11.8% of professionals.
- Poorly defined goals and KPIs limit effectiveness for 10.1% of marketers.
- Low visibility into email performance is an issue for 8.1% of email campaigns.

In-App Advertising Effectiveness
- 64% of marketers rank in-app ads as their top-performing mobile format for ROI in 2025.
- $148 billion is projected global revenue from in-app advertising this year.
- 38% of users engage with in-app ads through clicks, installs, or video views.
- Gaming apps account for 46% of all in-app ad impressions.
- 7.2% is the average conversion rate for rewarded video ads within apps.
- 61% of users say they don’t mind in-app ads if they enhance or unlock content.
- 36% of mobile marketers are investing in interactive in-app ad units (e.g., playable ads).
- 58% of in-app ad campaigns are now bought programmatically.
- 4.3x: In-app ads generate 4.3x higher engagement than mobile web ads.
- $3.7 billion in projected spend for native in-app ad formats in 2025.
Most Popular Mobile Ad Formats
- Video ads remain the most engaging mobile ad format, used in 74% of campaigns.
- Carousel ads on social media platforms see a 62% higher interaction rate on mobile than static formats.
- Playable ads lead with a 9.4% average engagement rate, especially in gaming and lifestyle apps.
- Story ads on platforms like Instagram and Snapchat capture 45% more attention than feed-based placements.
- Native display ads now make up 32% of mobile ad impressions.
- Interactive banner ads are used by 29% of app developers to increase user retention.
- Augmented Reality (AR) ads are used in 8% of mobile campaigns and are growing fast.
- Shoppable ads allow for real-time checkout from within the ad unit, now used by 37% of retail apps.
- Expandable rich media formats have a 3.5x higher dwell time than traditional banners.
- Audio ads in mobile music and podcast apps saw a 19% year-over-year increase in usage.
Mobile Ad Blocker Usage Trends
- 29% of mobile users worldwide actively use an ad blocker in 2025.
- 34% of Gen Z mobile users in the US report blocking ads regularly.
- 82% of mobile ad blockers are driven by slow page loads and irrelevant ads.
- 41% of mobile browsers now come with built-in ad-blocking features.
- 12.5% of in-app ad blockers target only video-based ads.
- 61% of marketers say ad blocking has forced a shift to native and content-driven advertising.
- 7.2 billion estimated annual losses in ad revenue due to mobile ad blocking.
- 21% of users who use blockers say they’d consider disabling them for non-intrusive experiences.
- 68% of ad blocker users still engage with branded content if it is well-integrated.
- 16% increase in privacy-focused browsers like Brave and DuckDuckGo for mobile in 2025.
Recent Developments
- Apple’s iOS 18 has introduced tighter restrictions on tracking permissions, affecting over 40% of mobile ad campaigns.
- Google Privacy Sandbox on Android rolled out in early 2025, impacting programmatic ad targeting.
- Meta’s Advantage+ Shopping Campaigns have been optimized for mobile-first conversions, now driving 18% higher ROAS.
- Snapchat’s My AI integration with sponsored lenses sees a 32% engagement uplift.
- Instagram Threads, Meta’s standalone app, has reached 200 million mobile users in under a year.
- Amazon Ads Mobile Network saw 22% growth in small business adoption in Q2 2025.
- TikTok Shop now accounts for 16% of US-based mobile retail sales under age 30.
- Pinterest mobile shopping ads now offer real-time inventory sync, increasing ROI by 28%.
- Adobe Firefly mobile tools allow creative teams to build AI-powered mobile-first ad creatives directly in-app.
- 5G adoption in the US surpassed 75%, enabling higher-quality mobile ad delivery and real-time AR experiences.
Conclusion
Mobile marketing in 2025 is no longer about just keeping up; it’s about leading with intent, personalization, and speed. With ad spend breaking records, consumers expecting seamless interactions, and formats evolving faster than ever, mobile has become the most critical frontier for marketers.
Brands that prioritize mobile-first design, embrace in-app innovations, and respect privacy boundaries are best positioned to grow. Whether you’re optimizing your push strategy, exploring shoppable video, or tightening your mobile funnel, 2025 is the year mobile marketing defines the customer journey.


