In 1995, only 0.77% of the world’s population was online. Fast forward to 2025, and nearly two-thirds of humanity now live a connected life. Whether it’s streaming news on a smart fridge in Texas or running a full business from a beach in Bali, the internet is no longer a luxury, it’s a lifeline. But with that growth comes complexity. Who’s online? Where are they logging in from? And how is mobile reshaping everything?
This article offers a clear, data-rich look at 2025 internet statistics, distilling a global flood of information into something you can actually use, whether you’re a marketer, policymaker, or just someone curious about the digital world we now live in.
Editor’s Choice
- As of January 2025, there are 5.53 billion active internet users globally, representing 68.8% of the world population.
- The average internet user now spends 6 hours and 39 minutes online daily, slightly up from last year’s average.
- Mobile devices account for 59.2% of total web traffic in 2025, showing continued dominance over desktops.
- Asia holds the highest number of internet users, with over 2.9 billion connected individuals.
- In the US, 94.1% of the population is now online in 2025, up from 92.6% in 2024.
- The global e-commerce market is expected to hit $6.57 trillion in 2025, driven by faster internet access and mobile commerce.
- 75% of global internet users say they are “very concerned” about their online privacy in 2025, an increase of 9 percentage points year-over-year.
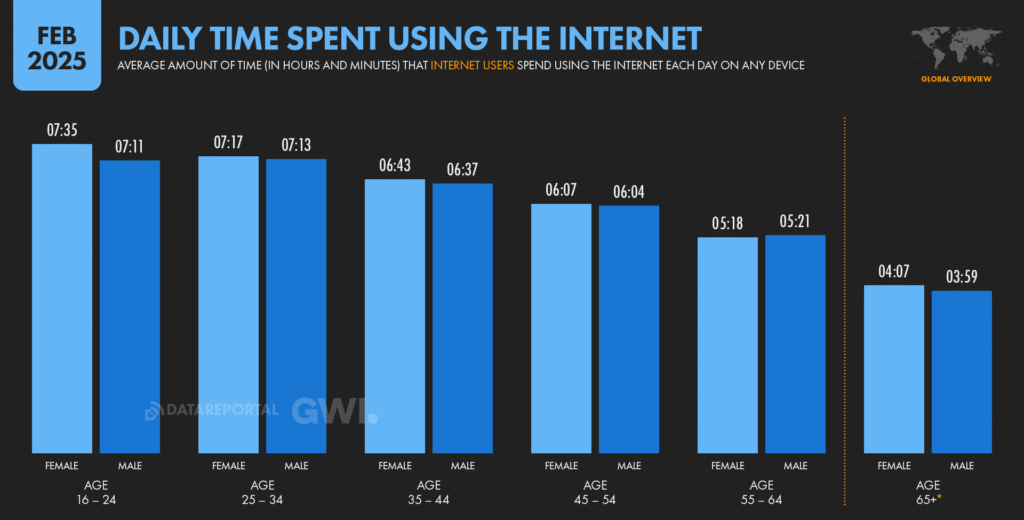
Daily Time Spent Using the Internet by Age and Gender
- Females aged 16–24 spend the most time online, averaging 7 hours and 35 minutes daily.
- Males aged 16–24 follow closely with 7 hours and 11 minutes per day.
- Users aged 25–34 show similar habits, with females at 7:17 and males at 7:13.
- Internet usage slightly declines among the 35–44 age group, with females at 6:43 and males at 6:37.
- For the 45–54 age range, females average 6:07, and males 6:04.
- Older users aged 55–64 show lower usage: females at 5:18, males at 5:21.
- Seniors (65+) spend the least time online, with females at 4:07 and males at 3:59 daily.
Global Internet Usage
- As of Q1 2025, the total number of internet users worldwide stands at 5.53 billion, growing by 2.4% compared to 2024.
- China, India, and the United States remain the top three countries by number of internet users in 2025.
- Africa now accounts for 13.1% of global internet users in 2025, up from 11.5% the previous year.
- North America sees internet penetration stabilizing, with 94.2% of the population online.
- Brazil surpassed 170 million internet users in 2025, marking a 3.1% increase from 2024.
- Global growth is being fueled by cheap smartphones and expanded 4G/5G networks, particularly in South Asia and Sub-Saharan Africa.
- More than 95% of people aged 18–29 in developed nations use the internet regularly in 2025.
Internet Penetration Rates by Region
- Northern Europe holds the highest internet penetration rate in 2025 at 97.2%.
- Central Asia improved its penetration rate to 76.4%, thanks to infrastructure expansion programs.
- Eastern Africa crossed the 30% internet penetration threshold for the first time in 2025.
- In Latin America and the Caribbean, the penetration rate hit 82.7%, up from 80.3% in 2024.
- The Middle East reached 78.9% internet penetration, aided by growing mobile broadband use.
- Southern Asia, including India and Bangladesh, now has an internet penetration rate of 58.6%.
- Oceania (including Australia and New Zealand) reports 93.5% penetration, one of the highest globally.
Internet Access at Home for Under 25s by Income Group
- In low-income countries, only 6% of under-25s have internet access at home, while a staggering 94% do not.
- In lower-middle-income countries, 15% of young people have home internet access, compared to 85% who are still without it.
- In upper-middle-income countries, 56% of under-25s have internet at home, while 44% do not.
- In high-income countries, a significant 87% of young people have home internet access, with only 13% lacking it.

Internet Connectivity
- 5G covers 51.6% of the global population as of early 2025, with most growth seen in Asia-Pacific.
- Average global broadband speed hit 97.3 Mbps in Q1 2025, up 12.1% from the previous year.
- In the United States, average broadband speeds reached 231.1 Mbps, ranking 6th globally.
- Starlink and other satellite internet providers now serve over 4.2 million global users in underserved areas.
- Wi-Fi 6 is now active in over 32% of households with internet connections worldwide.
- Urban connectivity outpaces rural by a factor of 2.7x, although rural coverage is narrowing the gap in 2025.
- Global public Wi-Fi hotspots have increased to 643 million, a 14.3% year-over-year rise.
Mobile’s Impact on Digital Connections
- 59.2% of all internet traffic in 2025 comes from mobile phones.
- In the US, 88.9% of internet users access the web primarily via mobile devices.
- Mobile-only internet users now represent 18.4% of global users in 2025.
- Africa leads in mobile-first usage, with 89% of users accessing the web solely on phones.
- The average time spent online via mobile devices globally is 4.4 hours/day in 2025.
- Mobile commerce (m-commerce) accounts for 72.6% of total e-commerce transactions in 2025.
- Mobile data consumption per user grew to 16.9 GB/month, a 9.6% increase from 2024.
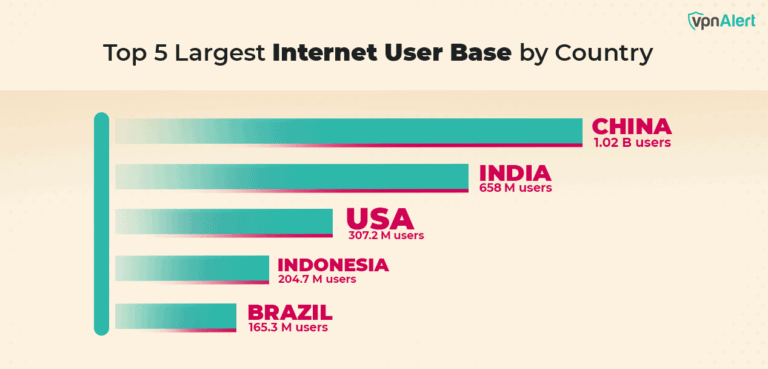
Top 5 Countries With the Largest Internet User Base
- China leads globally with 1.02 billion internet users, making it the largest online population in the world.
- India ranks second with a massive 658 million users, reflecting its fast-growing digital adoption.
- The United States has 307.2 million users, maintaining its position as one of the most connected countries.
- Indonesia comes in fourth with 204.7 million users, showcasing Southeast Asia’s rising internet penetration.
- Brazil holds the fifth spot with 165.3 million users, representing Latin America’s strongest online presence.
Global Internet User Demographics
- In 2025, 51.4% of internet users are male, while 48.6% are female globally.
- Users aged 18–34 represent 42.1% of all internet users in 2025.
- Gen Z (aged 10–24) spends the most time online, averaging 7.6 hours/day.
- Millennials (aged 25–40) make up 31.2% of the world’s internet user base.
- Users aged 65+ now account for 8.9% of the global internet population, showing consistent growth.
- In the US, 99% of adults aged 18–29 use the internet in 2025.
- Gender parity in internet access is highest in Europe and lowest in South Asia.
Internet Use Over Time
- Global internet usage has increased from 63.5% in 2024 to 68.8% in 2025, marking a 5.3-point rise in digital inclusion.
- The number of people who use the internet daily has reached 4.89 billion in 2025.
- In 2025, 84% of US adults report being online “several times a day,” with 48% stating they’re “constantly online.”
- Over the past decade, internet user numbers have grown at an average annual rate of 6.9% globally.
- Between 2020 and 2025, more than 1.3 billion new users joined the internet.
- The average time spent online daily increased to 6 hours and 39 minutes, up from 6 hours and 31 minutes in 2024.
- Social media, streaming, and e-commerce remain the top three internet activities globally in 2025.
- Weekly internet usage among teens in the US is now 52 hours, highlighting a surge in mobile and video content engagement.
- Global internet usage during working hours has risen by 18.2%, reflecting hybrid work adoption.
- Digital detox habits have declined in 2025, with only 9% of users taking regular breaks from internet use.
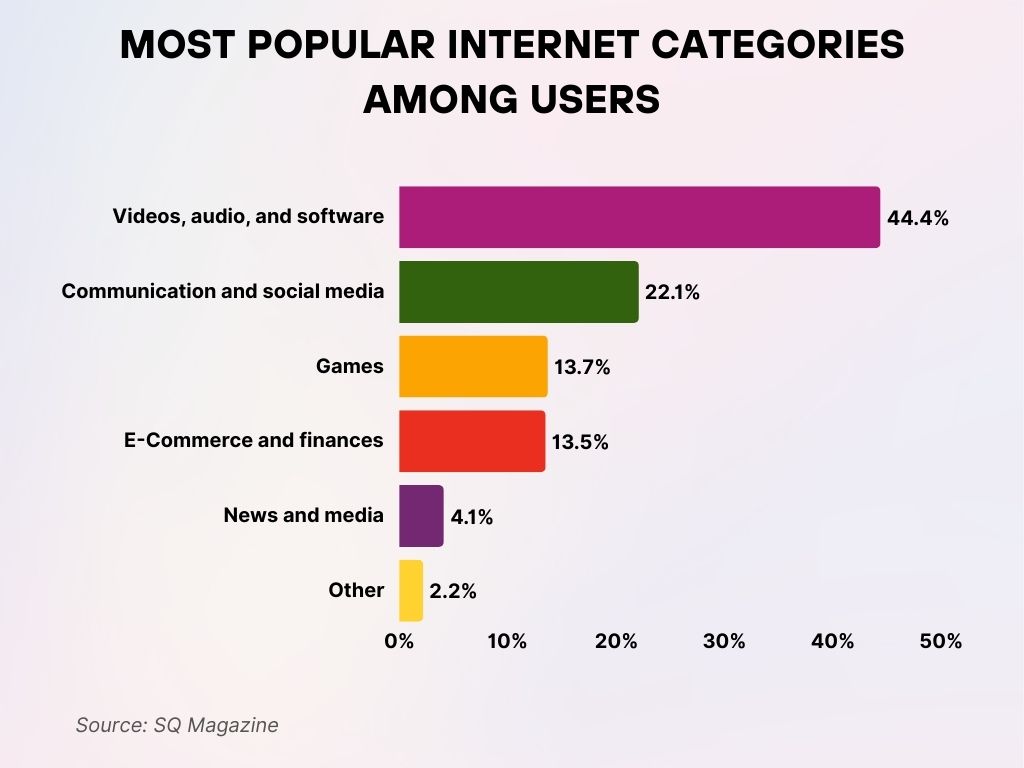
Most Popular Internet Categories Among Users
- Videos, audio, and software are the most accessed category, making up 44.4% of internet usage.
- Communication and social media follow next with 22.1%, highlighting the dominance of platforms like messaging apps and social networks.
- Games account for 13.7% of user activity, showing strong engagement in online gaming.
- E-commerce and finances represent 13.5% of internet use, indicating a steady rise in online shopping and digital banking.
- News and media capture only 4.1% of total usage, despite the global demand for information.
- Other categories make up the remaining 2.2%, covering less common internet activities.
Smartphone Dependency Over Time
- As of 2025, 91.7% of global internet users access the internet via a smartphone.
- In the US, 96.2% of adults own a smartphone, up from 94.8% in 2024.
- Smartphone-only households (no broadband) have risen to 22% in the US in 2025.
- Average smartphone screen time per user is now 4.8 hours/day, an all-time high.
- 72% of users say they “can’t imagine life without a smartphone,” according to a 2025 Pew survey.
- Mobile apps account for 86% of smartphone internet use, with browsers taking the remaining 14%.
- The global average number of apps used monthly per user is 35, with the US average at 41.
- Teen smartphone dependency in the US has reached 91%, up from 87% in 2024.
- Emerging economies, like Indonesia and Nigeria, report that over 95% of their internet users rely exclusively on smartphones.
- Smartphone-based digital payments grew by 15.9% in 2025, reflecting increased mobile wallet adoption.
Internet Traffic by Device Type
- Mobile phones will generate 59.2% of internet traffic globally in 2025.
- Desktop computers contribute 38.1% of total web traffic.
- Tablets now account for only 2.7% of internet traffic, a continued decline from previous years.
- In the US, desktops are still preferred for work-related browsing, holding 49% of weekday traffic share.
- Smart TVs and gaming consoles now make up 4.3% of home internet traffic.
- Wearables contribute marginally, with 0.6% of overall global traffic.
- In India, mobile traffic accounts for over 70% of total web usage.
- Online video streaming accounts for 57.9% of all downstream traffic across devices in 2025.
- In urban Asia, users switch between 3.1 connected devices daily on average.
- The average user in 2025 owns 6.4 connected devices, including phones, laptops, smart TVs, and voice assistants.
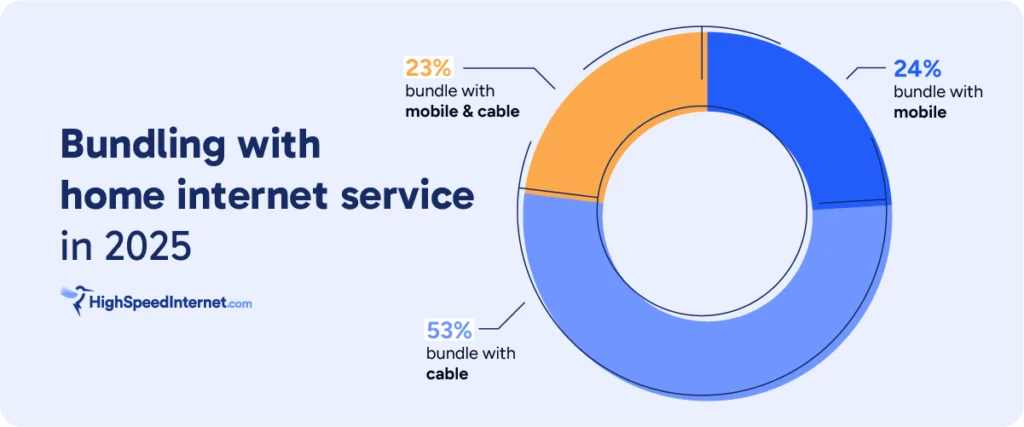
Bundling Preferences for Home Internet Services
- 53% of users bundle home internet with cable, making it the most popular option.
- 24% of users bundle with mobile services only.
- 23% choose to bundle with both mobile and cable, reflecting a trend toward all-in-one connectivity solutions.
Average Internet Speeds Worldwide
- The global average fixed broadband speed has reached 97.3 Mbps in 2025.
- Mobile internet speeds worldwide average 53.8 Mbps, with South Korea leading at 152.1 Mbps.
- United States ranks 6th globally with an average broadband speed of 231.1 Mbps.
- Singapore maintains its lead in fixed broadband with average speeds of 292.6 Mbps in 2025.
- Rural US broadband speeds average 92.4 Mbps, still behind urban rates but improving.
- In Africa, mobile internet speeds now average 27.5 Mbps, reflecting major infrastructure investment.
- The global mobile latency average has improved to 28 ms, enhancing video conferencing and gaming performance.
- Fiber-optic internet availability is now at 58.6% of global households, a 4% jump from 2024.
- 5G speeds are averaging 184 Mbps in 2025, with significant regional variance.
- Satellite internet providers like Starlink offer average download speeds of 135 Mbps, with global availability expanding.
Top Internet Service Providers by Market Share
- In the United States, Comcast leads with 33.7% broadband market share in 2025.
- AT&T follows closely at 29.4%, driven by fiber network expansion.
- Spectrum holds 22.8% of the US market, remaining stable year-over-year.
- In Europe, Deutsche Telekom, Orange, and BT Group dominate their respective national markets.
- China Telecom and China Mobile are the two largest ISPs globally by subscriber base, with over 400 million combined users.
- Reliance Jio in India serves 454 million users, the largest in a single-country market.
- Starlink has expanded to over 70 countries, with user numbers projected to reach 6.2 million by the end of 2025.
- In Africa, MTN Group leads with 290 million subscribers across multiple countries.
- The average internet cost per Mbps in the US is $0.78, down from $0.85 in 2024.
- The global average internet cost per Mbps is now $0.41, showcasing improved affordability.
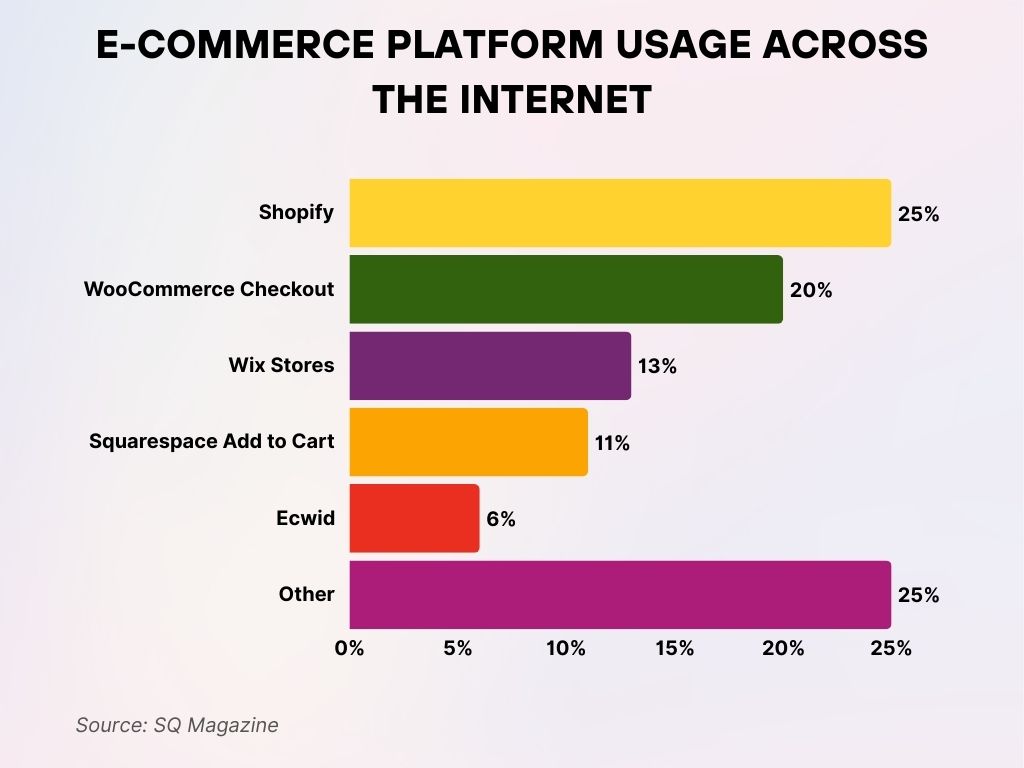
E-commerce Platform Usage Across the Internet
- Shopify leads the e-commerce landscape with a 25% share of websites using e-commerce technologies.
- WooCommerce Checkout is close behind, powering 20% of ecommerce-enabled sites.
- Wix Stores accounts for 13%, reflecting strong adoption among small businesses and creators.
- Squarespace Add to Cart contributes 11%, showing a growing preference among design-focused websites.
- Ecwid holds a 6% share, serving niche and embedded commerce users.
- Other platforms collectively make up 25%, indicating a diverse mix of additional e-commerce solutions in use.
Social Media and Internet Engagement
- 5.09 billion people use social media in 2025, representing 63.6% of the global population.
- The average user spends 2 hours and 27 minutes on social platforms daily.
- TikTok has surpassed 2.1 billion global users in 2025, becoming the fastest-growing app again.
- Facebook remains the largest platform globally with 2.95 billion monthly active users.
- Instagram boasts 2.3 billion users, with Stories and Reels accounting for 65% of engagement.
- Threads, Meta’s Twitter alternative, crossed 300 million users globally within its first year.
- The average American has 7.1 social media accounts in 2025.
- LinkedIn usage surged in Q1 2025, especially in the US and India, crossing 1.1 billion users globally.
- Social media now drives 34.2% of referral traffic to websites globally.
- 58% of global users report that social media is their primary source of news in 2025.
E-commerce Trends and Online Shopping Behavior
- The global e-commerce market is expected to reach $6.57 trillion in 2025, a 10.4% increase from 2024.
- Mobile commerce (m-commerce) accounts for 72.6% of all e-commerce sales globally.
- The average online shopper in the US spends $3,210 annually in 2025, up from $2,960 in 2024.
- Buy Now, Pay Later (BNPL) usage has risen to 39% of all digital shoppers in 2025.
- Voice-assisted shopping is used by 17% of online consumers globally.
- Cross-border e-commerce now represents 22.8% of total global online retail.
- The fastest-growing segment in 2025 is grocery e-commerce, with a 16.3% YoY growth rate.
- Social commerce is expected to generate $1.65 trillion in sales this year.
- Personalized recommendations influence 91% of US online purchases in 2025.
- Cart abandonment remains high, with an average global rate of 68.9% in Q1 2025.
Internet Advertising and Digital Marketing
- Digital ad spend globally is projected to hit $740 billion in 2025.
- Search advertising remains dominant, accounting for 42.1% of digital ad budgets.
- Video ads now capture 28.4% of total digital ad spending, largely due to TikTok and YouTube.
- The US digital ad market alone is valued at $303 billion in 2025.
- Retail media networks (e.g., Amazon, Walmart Connect) grew by 19.8% YoY.
- Programmatic advertising now represents 87% of display ad purchases globally.
- Influencer marketing is projected to be a $24.1 billion industry in 2025.
- Email marketing ROI stands at $42 for every $1 spent, showing resilience despite emerging platforms.
- First-party data strategies now drive 67% of targeted campaigns due to cookie phase-outs.
- B2B digital ad spending in the US reached $19.3 billion, fueled by LinkedIn and niche platforms.
Cybersecurity and Online Privacy Trends
- 75% of global users say they are “very concerned” about their online privacy in 2025.
- Ransomware attacks increased by 18.6% year-over-year in Q1 2025.
- Phishing remains the top attack vector, representing 42.7% of reported incidents.
- Global spending on cybersecurity solutions is expected to surpass $223 billion in 2025.
- Zero Trust architecture adoption reached 61% among enterprise-level organizations.
- In the US, 31% of consumers use a VPN daily in 2025.
- Biometric authentication is now used by 63% of mobile users for device and app access.
- Data breaches exposed over 5.6 billion records globally in the first half of 2025 alone.
- AI-driven cybersecurity tools are now deployed in 70% of Fortune 500 companies.
- Youth-targeted online scams rose by 32.3%, prompting new regulatory frameworks in several countries.
Internet of Things (IoT) Usage and Growth
- The number of active IoT devices globally is estimated to reach 18.4 billion in 2025.
- Smart home devices are present in 53% of US households.
- IoT in healthcare accounts for 12.6% of global device deployment in 2025.
- Connected cars on the road will exceed 420 million worldwide by the end of 2025.
- The industrial IoT (IIoT) market is projected to hit $498 billion this year.
- 5G-enabled IoT devices now make up 28% of all new connections in 2025.
- Asia-Pacific leads the IoT market with 44.1% of global share.
- Smart agriculture is projected to grow by 17.3% YoY, driven by connected sensors and automation.
- Wearables are now used by 32% of adults globally, often integrated with health apps.
- IoT cybersecurity investment reached $9.7 billion in 2025, addressing growing vulnerabilities.
Streaming and Online Content Consumption
- Video streaming accounts for 57.9% of total internet traffic in 2025.
- Netflix leads with 276 million global subscribers, followed by YouTube Premium at 152 million.
- Short-form video platforms like TikTok and Instagram Reels dominate under-25 demographics.
- Audio streaming platforms have 580 million users globally, with Spotify holding 31% of the market.
- Live streaming viewership grew by 14.2%, thanks to sports and gaming content.
- The average user spends 96 minutes/day watching streaming content.
- In the US, 91% of households subscribe to at least one streaming service.
- Smart TVs are now the leading device for content consumption in living rooms.
- Gaming streaming platforms like Twitch and Kick grew to 82 million daily users in 2025.
- Subscription fatigue is rising: 29% of users canceled at least one streaming service in the past 6 months.
Cloud Computing and Internet Infrastructure
- Global cloud services revenue is projected at $697 billion in 2025.
- Amazon Web Services (AWS) leads the market with 31.2% share, followed by Microsoft Azure at 25.1%.
- Hybrid cloud adoption among enterprises reached 68% in 2025.
- Edge computing is now a $19.5 billion industry, supporting real-time processing in IoT and AI.
- The average US business uses 4.7 cloud platforms, up from 3.9 in 2024.
- Data center energy consumption reached 1.3% of global electricity use.
- Multi-cloud strategies are employed by 82% of medium-to-large enterprises.
- Serverless computing is forecast to grow 26% YoY, as companies optimize app development.
- Cloud-native platforms now drive 58% of all new software deployments.
- Green cloud initiatives have led to a 12.8% reduction in carbon emissions across major providers.
Recent Developments in Global Internet Trends
- The metaverse user base surpassed 450 million, driven by gaming, virtual workspaces, and social hubs.
- AI-generated content now makes up 11% of all web content published in Q1 2025.
- Digital identity frameworks are being piloted in 24 countries, aiming to streamline access and security.
- Blockchain-based internet services are gaining ground, especially in finance and identity management.
- Quantum networking saw successful government-level testing in the EU and China in 2025.
- Neural interfaces for digital input are under active testing, with early success in medical applications.
- Decentralized web (Web3) adoption increased, especially among developers and digital creators.
- AI-powered virtual assistants are used by 67% of internet users weekly.
- Universal connectivity via low-orbit satellites is forecast to cover 95% of Earth’s landmass by year-end.
- 5G and Wi-Fi 6E convergence is unlocking new user experiences in gaming and real-time communication.
Conclusion
The internet in 2025 is no longer just an access point to information, it’s a fabric woven into how we live, shop, work, and relate. Whether through smartphones, IoT devices, or immersive digital experiences, online life is now deeply personalized and perpetually present. At the same time, the pressure for faster speeds, better privacy, and smarter infrastructure continues to shape what comes next.
Understanding these stats isn’t just about knowing numbers. It’s about seeing where we’re headed. And as we push into an even more connected future, these insights provide a critical compass for navigating the next digital frontier.


