In 2025, Amazon stands as a testament to relentless innovation and strategic expansion. From its humble beginnings as an online bookstore, it has evolved into a global conglomerate, influencing various sectors from cloud computing to entertainment. This transformation is not just about diversification but about setting benchmarks in each domain it enters.
This article delves into the latest statistics that showcase Amazon’s multifaceted growth, offering insights into its financial performance, service expansions, and market dynamics.
Editor’s Choice
- $638 billion in total revenue for 2024, marking an 11% year-over-year increase.
- $107.6 billion generated by AWS in 2024, reflecting a 19% growth from the previous year.
- 180.1 million Amazon Prime members in the U.S. as of 2025.
- 29% global cloud infrastructure market share held by AWS in Q1 2025.
- $14.2 billion in U.S. sales during Prime Day 2024.
- 37.6% share of the U.S. e-commerce market is controlled by Amazon.
- $29.3 billion in AWS revenue for Q1 2025, a 17% year-over-year increase.
Gender and Age Demographics Overview
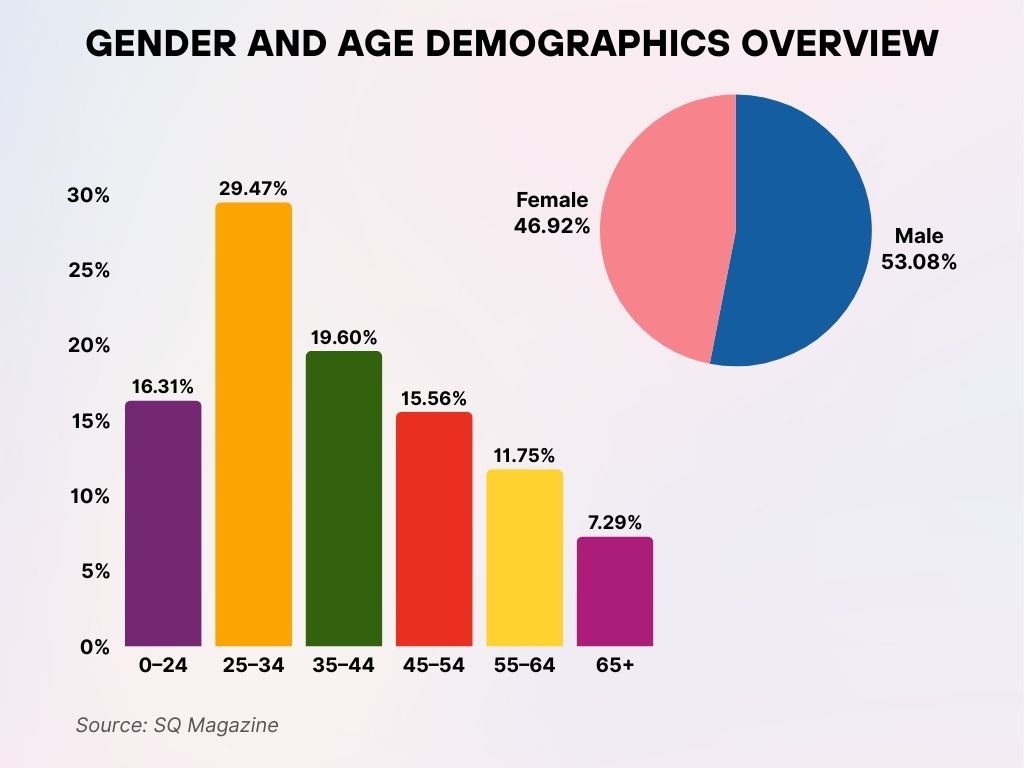
- Male users dominate the audience with 53.08%, while female users make up 46.92%, indicating a slightly male-skewed user base.
- The largest age group is 25–34 years, comprising 29.47% of the total audience.
- Young adults aged 0–24 account for 16.31%, showing strong engagement from Gen Z users.
- Users aged 35–44 represent 19.60%, making them the second-largest age segment after 25–34.
- The 45–54 age group makes up 15.56%, followed by 55–64 at 11.75%.
- The 65+ demographic accounts for the smallest share at 7.29%, suggesting limited senior engagement.
Total Revenue and Growth Trends
- $638 billion in total revenue for 2024, up from $575 billion in 2023.
- $155.7 billion in net sales for Q1 2025, a 9% increase from Q1 2024.
- $387.5 billion in North America segment sales for 2024, a 10% year-over-year growth.
- $142.9 billion in International segment sales for 2024, up 9% from the previous year.
- $18.4 billion in operating income for Q1 2025, compared to $15.3 billion in Q1 2024.
- $59.2 billion in net income for 2024, a significant rise from $30.4 billion in 2023.
- $113.9 billion in operating cash flow for the trailing twelve months ending March 31, 2025.
Amazon Prime Membership
- Over 200 million global Amazon Prime members as of 2025.
- 180.1 million Prime members in the U.S. in 2025, up from 174.9 million in 2023.
- 76.6 million U.S. households subscribed to Amazon Prime.
- $14.2 billion in U.S. sales during Prime Day 2024.
- 22% share of the U.S. streaming market held by Amazon Prime Video.
- 52.5 million U.S. users of Amazon Music.
- $11.278 billion in revenue from Prime subscriptions in Q3 2024, a 10.9% increase from Q3 2023.
US E-Commerce Market Share Highlights
- Amazon leads the market with a dominant 37.6% share, maintaining its position as the top e-commerce retailer in the US.
- Walmart holds 6.4%, securing second place among US e-commerce platforms.
- Apple accounts for 3.6% of the market, slightly ahead of eBay.
- eBay captures 3.0%, showing steady but smaller market presence.
- Other retailers combined represent the largest collective share at 49.4%, indicating a highly fragmented competitive landscape beyond the top players.

Amazon Web Services (AWS) Performance
- $107.6 billion in AWS revenue for 2024, a 19% year-over-year increase.
- $29.3 billion in AWS revenue for Q1 2025, up 17% from Q1 2024.
- $11.5 billion in AWS operating income for Q1 2025, compared to $9.4 billion in Q1 2024.
- 29% global cloud infrastructure market share held by AWS in Q1 2025.
- 4.19 million AWS customers in 2025, a 357% increase since 2020.
- 56.2% of AWS customers are located in North America.
- 92% of AWS customers spend less than $1,000 per month on services.
- $117 billion annual run rate for AWS as of Q1 2025.
- $39.8 billion in AWS operating income for 2024, up from $24.6 billion in 2023.
Global and Regional Market Share
- 37.6% share of the U.S. e-commerce market is controlled by Amazon.
- 310 million global Amazon users, with 80% based in the U.S.
- 197 million daily visitors to Amazon’s platform worldwide.
- $1.6 billion average daily sales revenue for Amazon.
- $638 billion in total revenue for 2024, an 11% increase from 2023.
- $ 387.5 billion in North America segment sales for 2024, a 10% year-over-year growth.
- $142.9 billion in International segment sales for 2024, up 9% from the previous year.
- $29.3 billion in AWS revenue for Q1 2025, a 17% year-over-year increase.
- 29% global cloud infrastructure market share held by AWS in Q1 2025.
Amazon Sellers’ Monthly Sales Breakdown
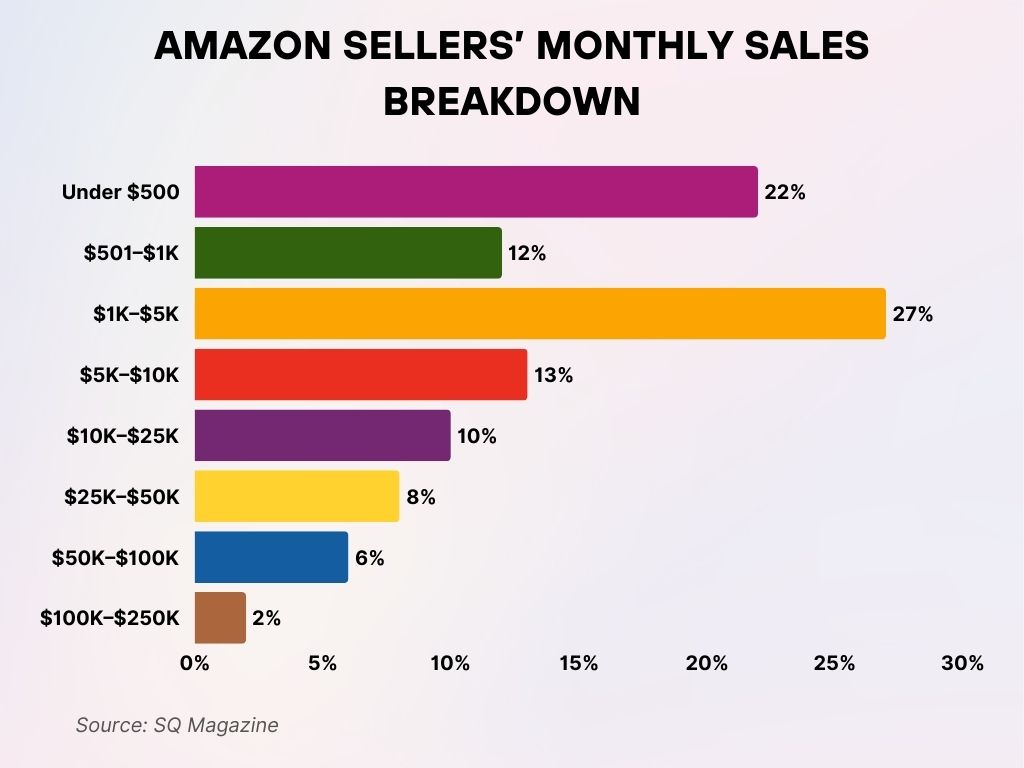
- The largest group of sellers (27%) earn between $1K and $5K per month, indicating a strong base of small to mid-level businesses.
- 22% of sellers make less than $500 monthly, suggesting a significant portion of low-volume or new sellers.
- Sellers earning $501 to $1K per month make up 12% of the marketplace.
- 13% of sellers generate $5K to $10K in monthly revenue.
- 10% of sellers fall in the $10K to $25K monthly sales bracket.
- Higher-earning segments include:
- 8% making $25K–$50K
- 4% earning $50K–$100K
- Only 1% of sellers reach $100K–$250K in monthly sales.
E-commerce Sales Volume and Product Categories
- As of early 2025, Amazon handles nearly 2.5 billion unique product listings across its global platform.
- In Q1 2025, Amazon’s total e-commerce sales in the U.S. surpassed $131 billion, maintaining its position as the #1 online retailer in the country.
- Electronics and media remain Amazon’s top-performing product categories, contributing over 24% of all global sales in 2025.
- The Health & Personal Care category saw a 13.7% year-over-year increase in 2025, making it the fastest-growing product segment on Amazon.
- In 2025, grocery-related purchases rose sharply, with Amazon Fresh and Whole Foods sales growing by 17.3% in the first quarter.
- Home and kitchen product sales accounted for 15.1% of Amazon’s global e-commerce revenue in Q1 2025.
- In the fashion segment, Amazon reported $20.6 billion in apparel and footwear sales in the U.S. during Q1 2025.
- Toys and games category purchases increased by 11% in Q1 2025, driven by seasonal demand and exclusive Amazon launches.
- Amazon Business e-commerce transactions exceeded $35 billion in 2025, led by bulk office and industrial supply orders.
- More than 38% of all product searches in the U.S. in 2025 began directly on Amazon, reinforcing its dominance in the product discovery stage.
Mobile and App Usage
- In Q1 2025, Amazon’s shopping app had over 105 million monthly active users in the U.S., a 6.5% increase from Q4 2024.
- The app ranked as the most downloaded retail app in the U.S. in January 2025.
- 72% of all Amazon purchases in the U.S. were made via mobile devices in Q1 2025.
- The average user spent 13.4 minutes per session in the Amazon app in early 2025, up 4.3% year-over-year.
- In-app voice search usage surged in 2025, with over 35 million U.S. users utilizing Alexa-enabled features to shop.
- Amazon’s mobile app maintained a 4.7-star average rating on the App Store and 4.4 stars on Google Play as of Q1 2025.
- Cart conversion rates on the Amazon mobile app reached 12.9% in Q1 2025, the highest in the e-commerce industry.
- Amazon’s mobile site and app traffic accounted for 65% of its global site visits in Q1 2025.
- Amazon launched “Visual Search 2.0” in 2025, enabling users to scan real-world items and instantly find similar products on the platform.
- Mobile push notifications drove a 9.2% increase in repeat customer orders in Q1 2025.
Amazon Yearly Gross Merchandise Volume (GMV) by Domain
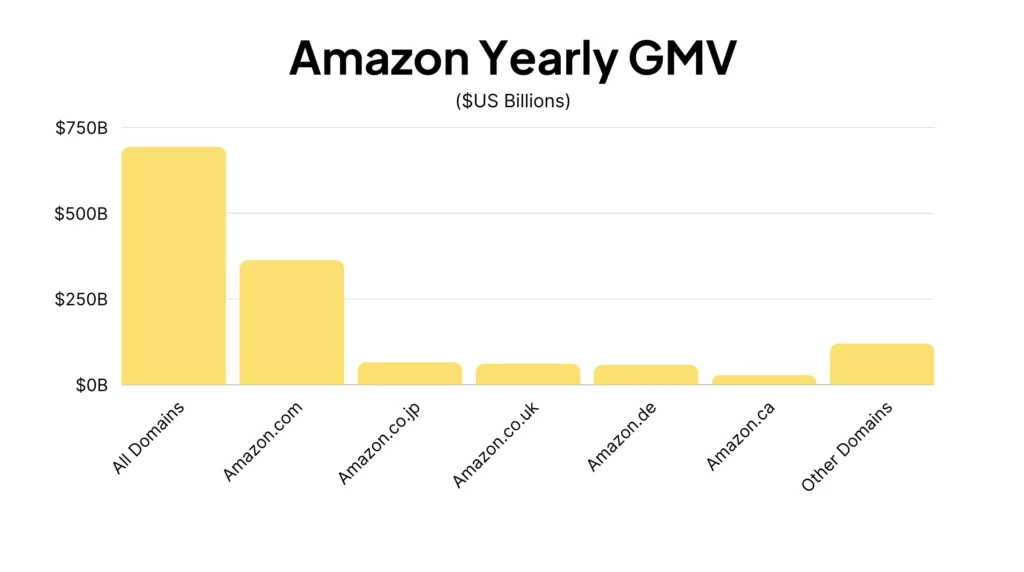
- All Amazon domains combined generated nearly $700B+ in yearly GMV.
- Amazon.com (US) alone accounted for over $350B, making it the largest contributor to total GMV.
- Amazon.co.jp (Japan) contributed around $75B, showing significant market activity in Asia.
- Amazon.co.uk (UK) and Amazon.de (Germany) each generated roughly $50B, reflecting a strong European presence.
- Amazon.ca (Canada) accounted for a smaller portion, approximately $25B.
- Other Amazon domains collectively made up over $100B, indicating substantial growth across smaller markets.
Advertising Revenue and Performance
- Amazon’s global ad revenue hit $52.3 billion in 2024, with projections placing Q1 2025 revenue at $14.6 billion, a 19% year-over-year increase.
- Sponsored Products made up 68% of total ad revenue in Q1 2025.
- Amazon DSP (Demand Side Platform) grew its advertiser base by 22% in Q1 2025.
- The average CPC (cost per click) across Amazon’s U.S. ad platform stood at $1.21 in Q1 2025.
- Return on ad spend (ROAS) averaged 4.2x for U.S.-based advertisers in Q1 2025.
- Video advertising formats on Amazon saw a 31% increase in impressions during Q1 2025, particularly on Fire TV and mobile placements.
- Amazon Ads introduced AI-driven predictive targeting tools in early 2025, improving ad conversion rates by 17.6%.
- Retail media share for Amazon Ads accounted for 78.5% of all retail ad spend in the U.S. in Q1 2025.
- Sponsored Brands and Stores received a 23% higher engagement rate than in the previous quarter, due to richer creatives and improved placement algorithms.
- Self-service ad spend among small businesses on Amazon increased by 15% in early 2025, demonstrating expanding access to advertising tools.
Third-Party Seller Metrics
- In Q1 2025, 61% of paid units sold on Amazon were by third-party sellers.
- The number of active third-party sellers on Amazon worldwide exceeded 2.5 million in 2025.
- FBA (Fulfillment by Amazon) sellers accounted for 89% of third-party orders in Q1 2025.
- On average, U.S. third-party sellers earned $280,000 in annual revenue as of Q1 2025.
- Over 50,000 sellers surpassed $1 million in annual sales by March 2025.
- More than 1.2 million sellers are using Amazon’s Brand Registry program in 2025.
- Amazon introduced Automated Pricing 2.0 in 2025, used by 30% of sellers to dynamically adjust pricing based on competitor listings and demand.
- Global sales increased by 14.5% in Q1 2025, with growth from Canadian, Indian, and UK-based sellers.
- Third-party sellers spent $4.7 billion on Amazon Ads in Q1 2025, up from $3.9 billion in Q4 2024.
- 70% of all third-party sellers now use at least one of Amazon’s integrated tools for advertising, inventory management, or pricing automation.
Top Reasons Why Consumers Prefer Shopping on Amazon
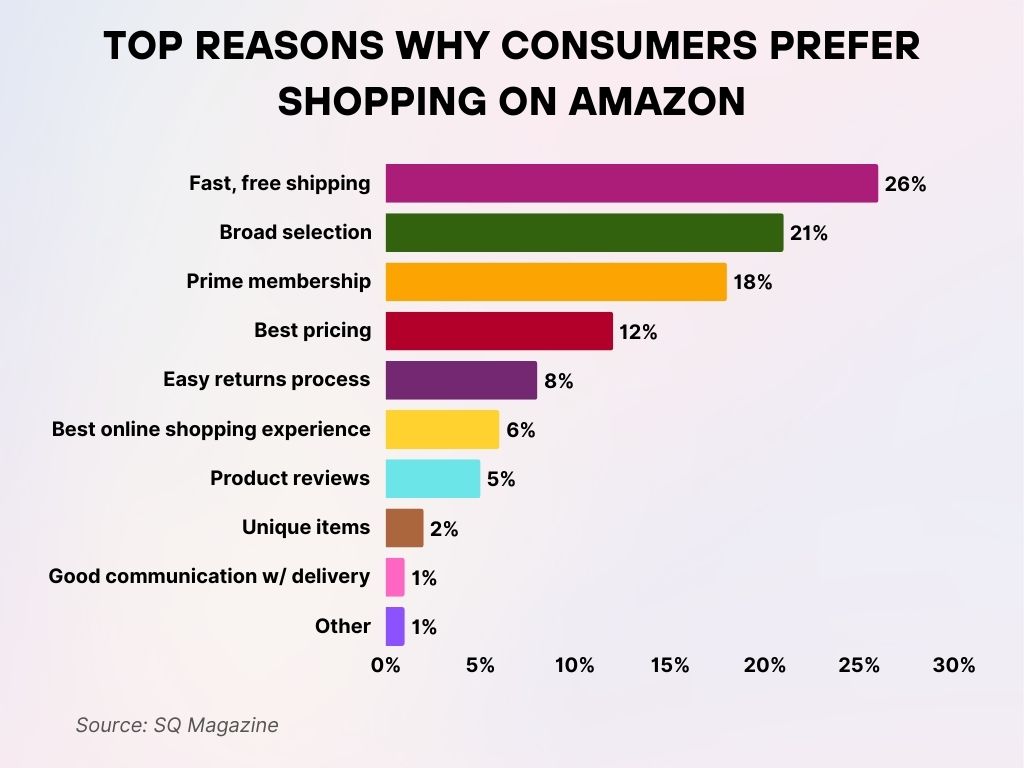
- 26.0% of shoppers choose Amazon for its fast, free shipping, making it the platform’s most compelling advantage.
- 21.0% value Amazon’s broad product selection, offering nearly everything in one place.
- 18.0% are motivated by the benefits of an Amazon Prime membership, including exclusive deals and expedited delivery.
- 12.0% say competitive pricing is a key reason they shop on Amazon.
- 8.0% appreciate the easy returns process, ensuring hassle-free refunds and exchanges.
- 6.0% believe Amazon delivers the best online shopping experience overall.
- 5.0% trust product reviews to guide their purchasing decisions.
- 2.0% shop on Amazon to find unique items not available elsewhere.
- 1.0% cite good communication and delivery updates as their reason for choosing Amazon.
- 1.0% fall under other miscellaneous reasons, showing niche preferences.
Brands in the Amazon Store
- As of 2025, more than 600,000 brands are selling directly on Amazon.
- 50% of U.S. consumers say they discovered a new brand on Amazon in Q1 2025.
- Amazon’s “Climate Pledge Friendly” program features over 400,000 products from more than 18,000 brands as of March 2025.
- The Amazon Exclusives program included over 10,000 niche brands in 2025, offering unique products not sold elsewhere.
- Amazon Launchpad backed over 1,200 startups in 2025, supporting innovation across consumer electronics and wellness categories.
- 30% of brands on Amazon now use A+ Content, improving conversion rates by up to 7.8% in Q1 2025.
- In 2025, 58% of brands selling on Amazon U.S. reported using Amazon Brand Analytics to refine their listings and target customers.
- Black-owned, Latinx-owned, and women-owned brands saw a combined growth of 12.4% in sales through Amazon’s supplier diversity initiatives.
- Amazon rolled out Brand Story Pages 2.0 in 2025, enhancing visual storytelling for DTC brands on product pages.
- Virtual Brand Consultants helped over 20,000 brands boost their presence on Amazon in Q1 2025.
Web Traffic
- In Q1 2025, Amazon.com received an average of 2.8 billion monthly visits, maintaining its status as the most visited e-commerce site globally.
- 80% of Amazon’s desktop traffic in the U.S. came from direct and organic search sources in early 2025.
- 54.7% of traffic originated from mobile devices, slightly up from 52.9% in Q4 2024.
- The average visit duration on Amazon.com reached 9 minutes 12 seconds, showing a higher user engagement trend in Q1 2025.
- The bounce rate for Amazon’s U.S. site decreased to 32.4%, reflecting improved customer retention from personalized shopping experiences.
- Amazon’s top traffic-driving keywords in 2025 include “wireless earbuds”, “home gym equipment”, and “eco-friendly cleaning products”.
- 1.2 billion unique visitors accessed Amazon via its mobile web interface in Q1 2025.
- Referral traffic from influencer partnerships grew by 15.6%, powered by Amazon’s updated Creator Connections platform.
- Amazon Live streams generated over 68 million views in Q1 2025, contributing to rising conversion rates on promoted products.
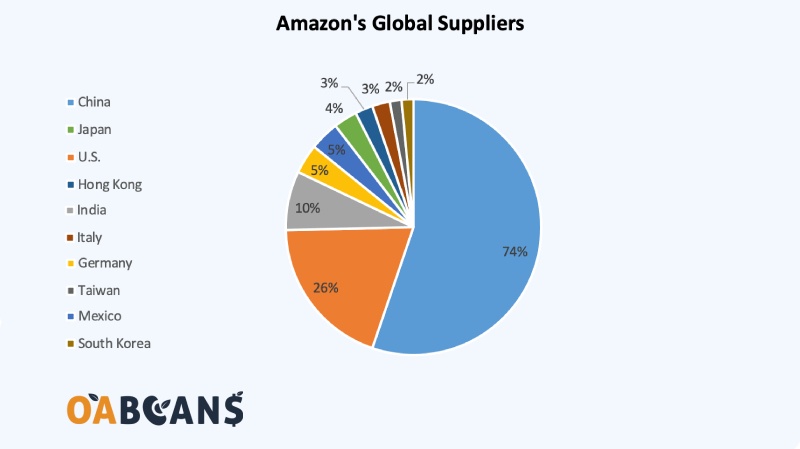
Amazon’s Global Supplier Breakdown
- China dominates Amazon’s supply chain, accounting for 74% of all global suppliers.
- Japan is the second-largest supplier, contributing 26% to Amazon’s global sourcing.
- The U.S. and Hong Kong each represent 5%, highlighting North American and Asian regional support.
- India supplies 4%, showing its growing role in Amazon’s network.
- Italy and Germany each make up 3%, reflecting notable European contributions.
- Taiwan and Mexico are responsible for 2% each.
- South Korea rounds out the list with 2% of suppliers.
Fulfillment Centers and Logistics Network
- As of 2025, Amazon operates more than 1,050 fulfillment centers and delivery stations globally, including over 410 in the U.S.
- Amazon Logistics now handles 74% of last-mile deliveries in the U.S., up from 69% in early 2024.
- Same-day delivery is available in over 110 U.S. metro areas, up from 95 in 2024.
- In Q1 2025, Amazon’s transportation services revenue reached $5.9 billion, a 12% year-over-year increase.
- Amazon Air fleet expanded to 118 cargo planes, enabling more efficient domestic overnight deliveries in early 2025.
- Amazon introduced “Delivery Drones 2.0” in 2025, capable of flying up to 9 miles with a 5-lb payload, now operational in 10 cities.
- Micro-fulfillment centers increased by 23% in 2025, reducing last-mile delivery time by 30% on average.
- The average fulfillment cost per unit dropped by 7.8% in Q1 2025, aided by increased automation and robotics deployment.
- Over 80% of seller-fulfilled Prime orders now meet 1–2 day delivery benchmarks, driven by logistics integration enhancements.
Employment and Workforce Insights
- As of Q1 2025, Amazon employs over 1.64 million full- and part-time workers globally.
- In the U.S., Amazon added 87,000 new jobs in the first quarter of 2025, largely in fulfillment and tech roles.
- Amazon’s average hourly wage in U.S. fulfillment centers increased to $19.65, up 4.8% from 2024.
- 58% of Amazon’s global workforce identifies as racially or ethnically diverse in 2025.
- Amazon’s return-to-office hybrid policy was implemented in Q1 2025, with 65% of corporate employees attending in-person work 2–3 days per week.
- The company invested $2.1 billion in workforce upskilling programs in Q1 2025, covering cloud certifications, data analytics, and AI.
- Injury rates in fulfillment centers decreased by 12.9%, following a new AI-enabled safety training program.
- Amazon extended paid parental leave to 20 weeks in 2025, leading to a 21% improvement in employee satisfaction scores among caregivers.
Sustainability and Environmental Initiatives
- In 2025, Amazon powered 93% of its operations using renewable energy, aiming for 100% by 2026.
- The company added 120 solar and wind projects in Q1 2025, totaling 1.6 gigawatts in new clean energy capacity.
- 400 million packages in Q1 2025 were shipped using recyclable or compostable materials.
- Amazon’s carbon emissions dropped by 9.4% in early 2025, with major cuts in transport and facility energy usage.
- Over 18,000 products now qualify for Amazon’s Climate Pledge Friendly label in the U.S.
- The company launched eco-friendly delivery vans in 300 U.S. cities, contributing to a 12% drop in last-mile emissions.
- Water conservation initiatives in data centers helped reduce water usage intensity by 7.1% in Q1 2025.
- Amazon’s partnership with The Nature Conservancy expanded in 2025 to include reforestation projects across Brazil and Southeast Asia.
- Amazon Second Chance returned over 11 million items to circulation through repair, reuse, or recycling channels in Q1 2025.
Recent Developments
- In Q1 2025, Amazon launched its AI-driven shopping assistant, “Rufus,” now integrated into the mobile app.
- Amazon Pharmacy expanded same-day delivery to 20 additional metro areas in 2025.
- The company acquired Fetch Robotics to boost warehouse automation, expected to increase order processing speed by 18%.
- Amazon introduced “Project Helix”, a new initiative focusing on AI-generated product listings, with 70% adoption among third-party sellers.
- The first Amazon Style 2.0 store opened in Los Angeles in early 2025, combining physical retail with smart fitting rooms and personalized AI suggestions.
- AWS Clean Rooms, a privacy-centric data collaboration tool, saw a 63% increase in adoption among enterprise clients in Q1 2025.
- Amazon announced Project Verdant, targeting net-zero emissions across its global supply chain by 2040, with key 2025 benchmarks being met early.
Conclusion
Amazon’s 2025 landscape illustrates a tech-powered, customer-centric, and environmentally conscious giant in constant evolution. From skyrocketing AWS earnings to its sustainability milestones, Amazon’s continued dominance in commerce, logistics, and cloud innovation reveals a company that’s not just keeping pace with the future, it’s helping define it.


