WHAT WE HAVE ON THIS PAGE
- Editor’s Choice
- iOS App Store Statistics Overview
- Global App Store Revenue Trends
- Most Downloaded Apps on the App Store
- American Apple Pay User Penetration
- Top Grossing App Categories
- User Demographics and Regional Insights
- Apple Revenue Breakdown by Product
- App Store Subscription and In-App Purchase Statistics
- Average App Pricing and Monetization Models
- Global App and Smartphone Usage
- Developer Distribution and App Volume Growth
- App Store Optimization (ASO) Trends and Impact
- Top Grossing Mobile Apps of All Time
- iOS vs. Android Store Performance Comparison
- Impact of App Tracking Transparency (ATT) on Revenue
- Top 5 Most Popular App Categories on the Apple App Store
- App Store Fraud and Policy Enforcement Statistics
- Emerging Markets and Growth Opportunities
- Recent Developments
- Conclusion
- Sources
In the early days of the smartphone revolution, a small indie developer in Austin, Texas, uploaded a simple puzzle app to the Apple App Store. Within a week, it hit 250,000 downloads, changing the creator’s life overnight. Fast forward to 2025, and that same app is now just one of over 1.96 million available in the iOS App Store ecosystem. Today, app stores are more than digital marketplaces—they’re cultural hubs, revenue engines, and critical infrastructure for global businesses.
Whether you’re a developer, marketer, or curious consumer, understanding the evolving trends of the App Store in 2025 can give you a competitive edge. Let’s dive into the numbers driving the mobile app economy forward.
Editor’s Choice
- The Apple App Store is projected to generate $138 billion in revenue globally in 2025, a 16.9% increase from the previous year.
- Over 92 billion apps are expected to be downloaded from the iOS App Store by the end of 2025.
- Gaming remains dominant, with games accounting for 60% of App Store revenue, exceeding $82 billion in 2025 alone.
- Subscription-based apps make up nearly 44% of all revenue on the iOS App Store, with lifestyle and fitness apps seeing the highest growth rate.
- The United States remains the top App Store market, responsible for nearly 31% of total global revenue.
- China, Japan, and the UK follow as the next largest contributors, with China alone contributing $25 billion in App Store revenue.
- App install ad spend on iOS is projected to hit $71.4 billion in 2025, driven by increased competition and post-IDFA strategy shifts.
iOS App Store Statistics Overview
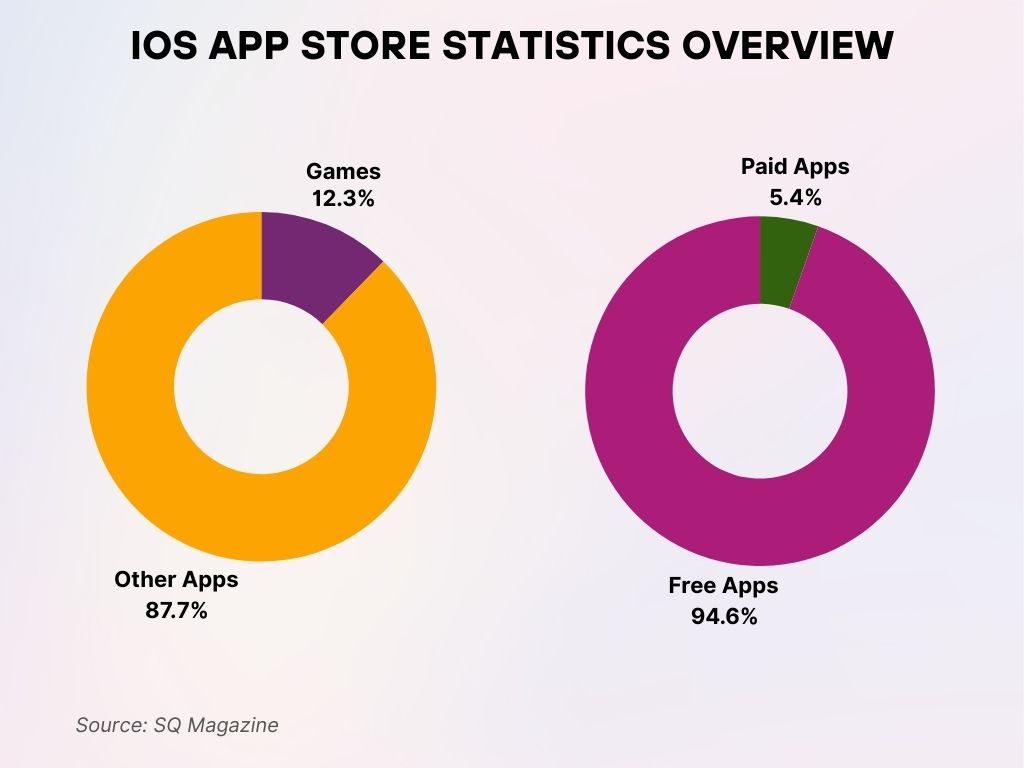
- The iOS App Store hosts a total of 1,745,556 apps as of the latest count.
- Games make up 12.3% of all available apps, showing a significant focus on entertainment.
- Non-game apps account for the remaining 87.7%, dominating the App Store’s offerings.
- Only 5.4% of apps are paid, indicating that most developers opt for freemium or ad-based models.
- A vast 94.6% of apps are free, highlighting strong competition in free app markets.
Global App Store Revenue Trends
- Global app store revenue (across iOS and Android) is projected to surpass $270 billion in 2025, with Apple’s share at 51%.
- In-app purchases account for 72% of all revenue generated through the App Store in 2025, with the remaining from subscriptions and paid apps.
- Non-gaming apps will grow faster than gaming apps, contributing $56 billion in revenue compared to gaming’s $82 billion on iOS.
- AR and VR apps are expected to see the largest year-over-year growth at +38%, fueled by integration with Apple Vision Pro and similar devices.
- The App Store will support over 185 languages, contributing to higher global accessibility and adoption.
- Consumer spending in the U.S. App Store alone is estimated to hit $43 billion, up from $38 billion in 2024.
- In Europe, App Store revenue is projected at $22.5 billion, with Germany, France, and the UK driving the majority.
- Latin America is growing fast, with Brazil alone expected to contribute $1.9 billion in 2025 App Store sales.
- India’s App Store market size is forecasted to grow by 19%, reaching $2.7 billion by year-end.
- Annual developer payouts via the App Store are expected to cross $80 billion, reflecting both volume and higher monetization efficiency.
Most Downloaded Apps on the App Store
- In 2025, TikTok remains the most downloaded app globally on iOS, with over 980 million installs.
- Instagram ranks second, with nearly 920 million downloads, driven by Reels and new generative AI content tools.
- CapCut sees over 520 million downloads, propelled by its integration with TikTok creators.
- Among new entrants, Lensa AI climbed to the top 10 with over 130 million downloads in just five months.
- Threads by Meta saw a resurgence in 2025, now at 260 million installs, thanks to new community features.
- Temu, the fast-fashion shopping app, continues its streak with 460 million iOS downloads globally.
- Duolingo remains the most downloaded educational app, with 275 million installs.
- In the U.S., YouTube, Facebook, and Amazon remain in the top 10, collectively driving over 1.5 billion installs.
- BeReal continues to appeal to Gen Z, recording 190 million downloads in 2025, mostly in North America and Europe.
- WhatsApp, although pre-installed in many regions, still sees strong numbers, with 480 million iOS downloads globally.
American Apple Pay User Penetration
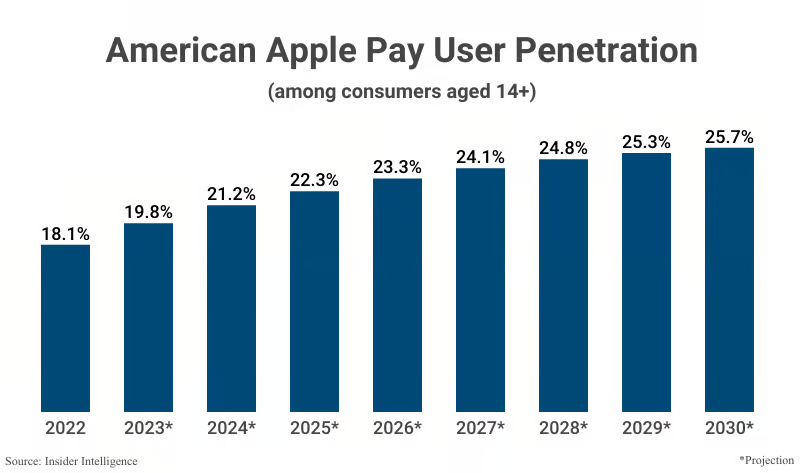
- The rate is expected to hit 22.3% in 2025, with annual increases.
- By 2026, Apple Pay usage may reach 23.3% of eligible users.
- The figure is projected to climb to 24.1% in 2027.
- In 2028, penetration could reach 24.8%, nearing a quarter of the population.
- 2029 projections show 25.3%, continuing the incremental growth.
- By 2030, Apple Pay user penetration is forecasted at 25.7%.
Top Grossing App Categories
- Games remain the top-grossing App Store category, with a forecasted $82 billion in revenue in 2025.
- Social networking apps generated $16.7 billion, led by TikTok, YouTube, and new AI video platforms.
- Entertainment apps, including streaming platforms like Disney+ and HBO Max, contributed $12.5 billion.
- Health & fitness apps saw a revenue jump of 24% YoY, generating $6.3 billion in 2025.
- Dating apps, led by Tinder and Bumble, amassed $4.1 billion, with Bumble’s revenue growing by 29%.
- Productivity and business apps earned $4.8 billion, with Zoom and Notion maintaining strong performance.
- Finance apps generated $5.6 billion, bolstered by investment and crypto wallet tools.
- Shopping apps, such as Temu and Amazon, reported $9.3 billion in combined iOS user spend.
- Education apps showed stable growth, hitting $3.2 billion in App Store revenue.
- Lifestyle apps (e.g., astrology, journaling, mental health) surpassed $2.6 billion, showing a shift toward wellness and habit-building.
User Demographics and Regional Insights
- Millennials and Gen Z dominate the App Store, with users aged 18–34 making up 63% of total app downloads in 2025.
- The gender split is narrowing: 51% of App Store users identify as female, up from 47% in 2022.
- In the U.S., urban users account for 72% of app purchases, with suburban and rural users trailing behind at 21% and 7%, respectively.
- Asia-Pacific holds the highest number of active App Store users, with over 1.3 billion monthly active devices.
- Chinese iOS users spend on average $22.60 per month on apps, surpassing U.S. users at $19.40 per month.
- European users are highly engaged with subscription-based services, particularly in fitness, entertainment, and education apps.
- Latin American iOS users have grown by 16% YoY, with Brazil and Mexico leading the surge.
- Middle Eastern markets such as Saudi Arabia and the UAE are becoming key iOS growth hubs, with over 48% YoY growth.
- India’s iOS app usage has grown 23%, driven by a rising middle class and digital-first behavior.
- Over 40% of U.S. iOS users report using apps for personal finance or investment tracking regularly.
Apple Revenue Breakdown by Product
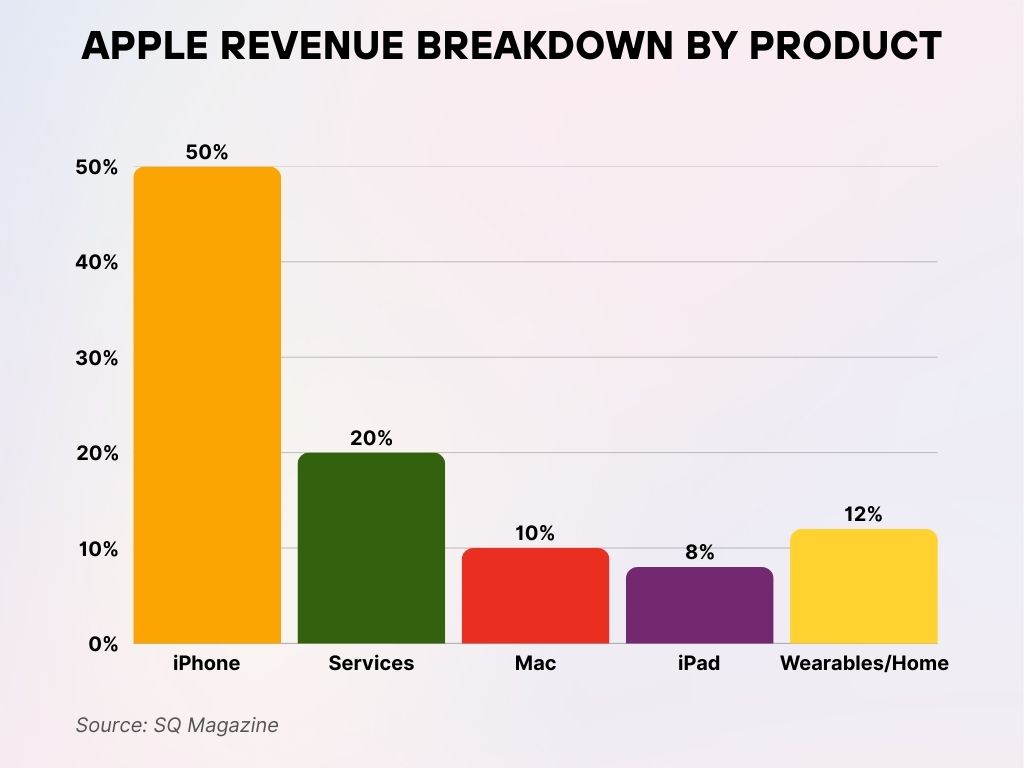
- The iPhone leads Apple’s revenue stream, contributing 50% of the total share in 2025.
- Services come next, accounting for 20% of Apple’s revenue, highlighting the growth of its digital ecosystem.
- The Mac line contributes 10%, showing continued demand for Apple’s computer lineup.
- iPad sales represent 8% of the total, reflecting stable yet smaller demand in the tablet segment.
- Wearables and Home devices, including AirPods and HomePods, make up 12% of Apple’s revenue in 2025.
App Store Subscription and In-App Purchase Statistics
- Subscription-based revenue is expected to hit $61 billion globally on iOS in 2025.
- The average subscription price across App Store apps increased by 8.5% year-over-year, now averaging $7.59/month.
- In-app purchases (IAPs) make up 72% of non-subscription revenue, showing continued dominance in mobile gaming and lifestyle apps.
- The top 100 subscription apps account for 80% of all subscription revenue, showing heavy concentration at the top.
- Dating, fitness, and productivity apps have the highest subscription conversion rates, averaging 12% of downloads turning into paying users.
- In the U.S., nearly 48 million iOS users have at least one active app subscription.
- Apple takes a 30% commission from subscriptions in the first year, dropping to 15% in subsequent years, still a contentious point for developers.
- Annual subscriptions now account for 37% of all subscription revenue, showing a shift from monthly billing.
- Freemium models dominate, but apps offering 7-day free trials see 18% higher conversion to paid plans.
- Cross-platform subscriptions (e.g., iOS + web access) are now a standard monetization strategy for over 65% of top-grossing apps.
Average App Pricing and Monetization Models
- Only 6% of iOS apps are paid upfront in 2025, down from 9.4% in 2020, showing a clear preference for freemium models.
- The average price of paid iOS apps is $1.23, while top-tier professional apps can reach $29.99 or more.
- Gaming apps lead in revenue per user (ARPU), with premium mobile games earning an average of $3.74 ARPU monthly.
- Utility and productivity apps charge the highest for one-time purchases, with popular options like PDF editors priced around $9.99.
- Subscription + IAP hybrid models are rising, now used by over 35% of the top 200 apps.
- Ad-supported apps account for 38% of downloads but generate only 14% of overall revenue, showing declining efficiency.
- Rewarded ads (watch to unlock features) have the highest user engagement, especially in games and fitness apps.
- Dynamic pricing based on usage behavior is being tested in 15% of subscription apps, adapting the price to user frequency.
- AI-generated personalization is increasingly integrated into monetization flows, enhancing perceived app value.
- App bundles and family plans are now offered by 27% of paid apps, increasing household reach and retention.
Global App and Smartphone Usage
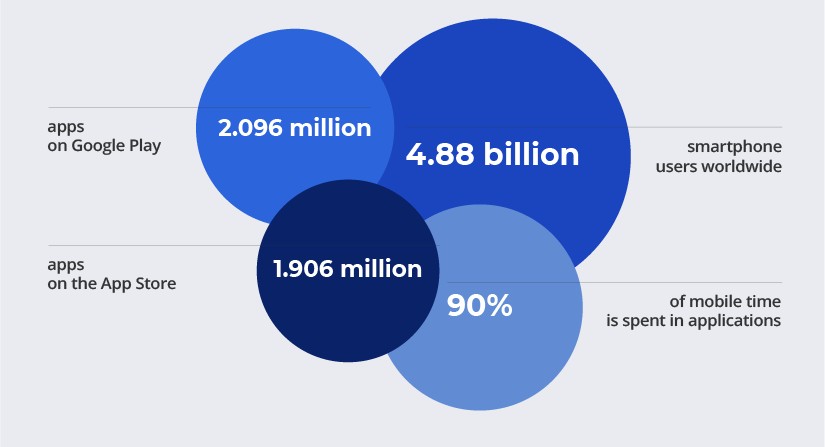
- There are 4.88 billion smartphone users worldwide, reflecting near-universal mobile device adoption.
- 2.096 million apps are available on Google Play, making it the largest app marketplace.
- The App Store offers 1.906 million apps, maintaining a robust presence for iOS users.
- Users spend 90% of their mobile time in applications, underlining the dominance of apps in smartphone usage.
Developer Distribution and App Volume Growth
- As of early 2025, the App Store hosts over 1.96 million live apps, up from 1.83 million in 2024.
- Roughly 37% of apps on the App Store are developed by independent developers or small teams (<5 people).
- The United States leads in developer count, followed by India, the UK, and Canada.
- Enterprise app development for internal use is growing, with over 112,000 private iOS apps registered under business accounts.
- The average app lifespan is now 8.4 months, a slight improvement due to better retention strategies.
- Over 450,000 new apps were submitted to the App Store in 2024 alone, with less than 60% approved after first submission.
- Over 30% of all apps have fewer than 100 downloads, reflecting a long-tail distribution in the app economy.
- Gaming and utility apps make up 51% of total app volume on the platform.
- AI-enhanced app creation platforms (e.g., FlutterFlow, Adalo) have enabled a 31% increase in no-code submissions.
- App Store Connect usage by developers rose by 24%, indicating higher engagement with app analytics and testing tools.
App Store Optimization (ASO) Trends and Impact
- Keyword optimization remains the most-used ASO tactic, with 78% of top-ranked apps updating metadata quarterly.
- Custom product pages increased installs by up to 36%, particularly in seasonal campaigns.
- App icon A/B testing tools have led to conversion increases of 14% on average when optimized properly.
- Apps using App Preview videos in listings see a 22% higher conversion rate compared to those using only screenshots.
- Localized app store listings improved install rates by up to 48% in multilingual markets.
- Ratings and reviews directly correlate with App Store ranking, with 4.5+ rated apps being twice as likely to appear in the top 50.
- In-app events boosted re-engagement by up to 17%, particularly for games and lifestyle apps.
- ASO automation tools, like AppTweak and SplitMetrics, saw usage growth of 41% in 2025.
- Visual refreshes (icon + screenshot revamp) are now a biannual strategy for top-performing apps.
- Store kit A/B experiments in TestFlight have become a standard for pre-launch optimization, especially for subscription apps.
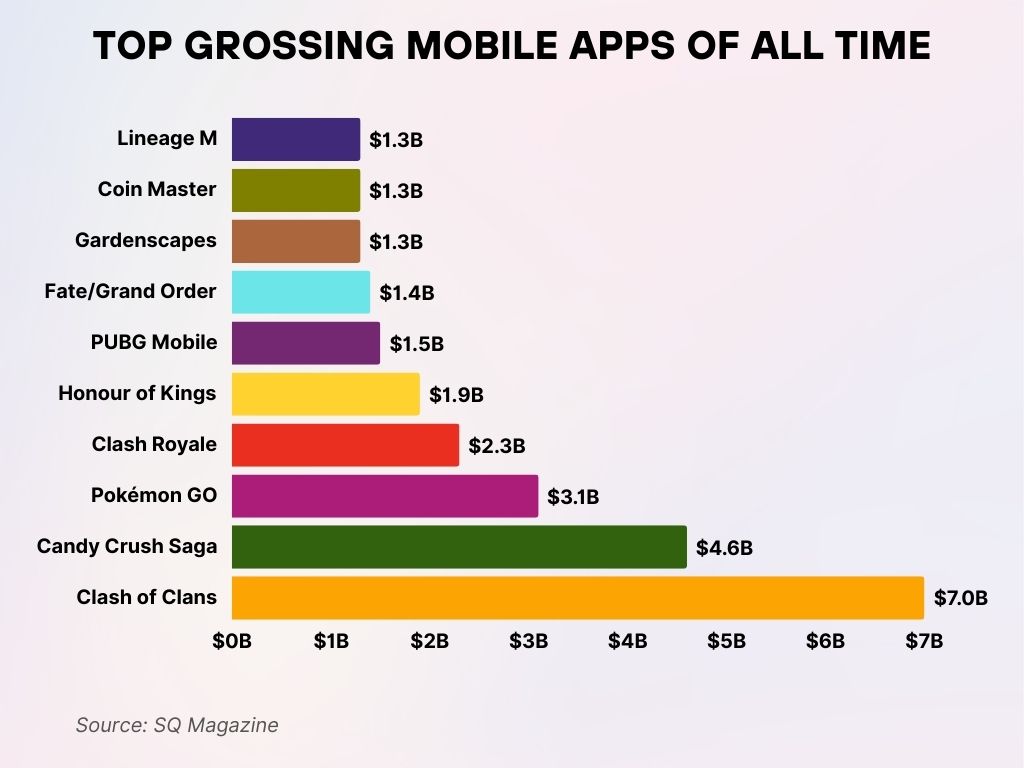
Top Grossing Mobile Apps of All Time
- Clash of Clans leads all apps with a massive $7 billion in lifetime revenue.
- Candy Crush Saga ranks second, earning $4.6 billion, driven by casual gaming popularity.
- Pokémon GO has generated $3.1 billion, powered by its global augmented reality appeal.
- Clash Royale brought in $2.3 billion, showing strong engagement among strategy game players.
- Honour of Kings has earned $1.9 billion, dominating mobile eSports in Asia.
- PUBG Mobile achieved $1.5 billion, highlighting mobile shooter demand.
- Fate/Grand Order follows closely with $1.4 billion in revenue from its anime RPG fanbase.
- Lineage M, Coin Master, and Gardenscapes each made $1.3 billion, rounding out the top-earning titles.
iOS vs. Android Store Performance Comparison
- The App Store (iOS) generated $138 billion in 2025, while the Google Play Store brought in $80 billion, showing iOS’s stronger monetization.
- Despite Android having more users globally, iOS users spend nearly 2x more per app than Android users.
- The App Store has a 16% share of global downloads, while Google Play accounts for 70%, largely due to device volume.
- iOS users in the U.S. and Europe contribute over 60% of Apple’s app revenue, while Android dominates in India, Brazil, and Indonesia.
- Gaming revenue on iOS is 25% higher than on Android, despite fewer downloads, indicating stronger in-app spending.
- Apple’s subscription revenue is nearly 3x higher than Google Play’s, led by lifestyle, entertainment, and productivity apps.
- The App Store sees 40% lower app churn compared to Android, attributed to tighter UX, payment integration, and better device retention.
- iOS users are 36% more likely to make repeat purchases within an app compared to Android users.
- Android developers release updates more frequently, but iOS apps have higher ratings on average (4.6 vs 4.2 stars).
- Revenue per install (RPI) on iOS is $2.12, versus $0.85 on Android, highlighting premium market dynamics.
Impact of App Tracking Transparency (ATT) on Revenue
- Since its launch, ATT has caused a 40–60% drop in iOS ad tracking data, reshaping user acquisition strategies.
- App developers using SKAdNetwork saw CPMs drop by 28%, but maintained ROAS through contextual targeting.
- iOS ad spend shifted toward influencer marketing and first-party data, with 2025 spending reaching $16.4 billion in non-programmatic channels.
- Finance, fitness, and productivity apps were hit hardest by ATT, seeing a 22% decrease in attributed installs.
- Gaming apps recovered faster, investing in probabilistic attribution and on-platform retargeting.
- Apple Search Ads grew by 37% in 2025, now capturing nearly 25% of performance ad budgets for iOS apps.
- User opt-in rates for tracking remain at ~24%, though this figure climbs to 42% in utility apps with strong user trust.
- Apps with transparent onboarding and value-based messaging saw a 16% higher opt-in rate than apps using default prompts.
- Privacy-focused features (like anonymous logins) are now a selling point, especially in health and finance categories.
- Developers increasingly use cohort modeling and in-app behavior segmentation to replace precise user tracking.
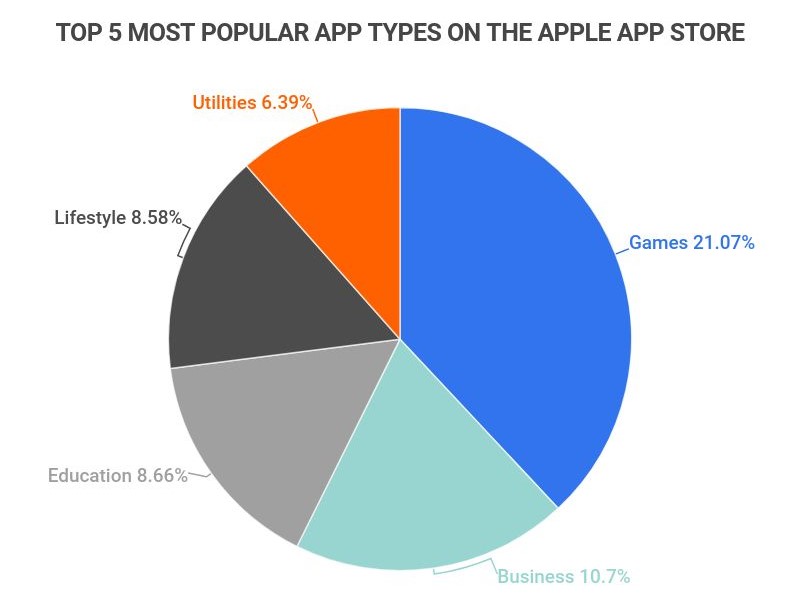
Top 5 Most Popular App Categories on the Apple App Store
- Games dominate the App Store, accounting for 21.07% of all apps.
- Business apps come next with a 10.7% share, reflecting productivity demand.
- Education apps represent 8.66%, showing a strong interest in learning tools.
- Lifestyle apps make up 8.58% of the App Store’s offerings.
- Utilities are the fifth most popular category, contributing 6.39% of all available apps.
App Store Fraud and Policy Enforcement Statistics
- In 2025, Apple blocked over $1.8 billion in potentially fraudulent transactions, continuing its annual crackdown.
- Nearly 200,000 apps were rejected during submission for violating App Store guidelines, including deceptive pricing and data abuse.
- More than 110,000 developer accounts were terminated in the past year due to fraud and malicious activity.
- Apple’s automated review tools now scan for over 250 violation types, from fake reviews to API misuse.
- Fake review detection has improved, with review fraud falling 38% YoY thanks to machine learning interventions.
- App Store appeals have a 19% reversal rate, with most successful claims tied to misinterpretation of metadata policies.
- Apple has removed over 2.3 million outdated or abandoned apps since early 2024, cleaning up the store ecosystem.
- Over 147 countries have reported improved digital safety due to Apple’s global App Store policy enforcement.
- Security patches must now be submitted within 24 hours for high-severity vulnerabilities, increasing app responsiveness.
- Parental control and age-gated app compliance audits rose by 23%, ensuring better protection for underage users.
Emerging Markets and Growth Opportunities
- India, Brazil, Nigeria, and Vietnam are the fastest-growing iOS app markets in 2025, showing double-digit growth rates.
- India’s iOS user base grew by 23% YoY, driven by localized pricing and increased iPhone SE sales.
- Nigeria’s iOS app revenue is projected to hit $610 million in 2025, up from $490 million in 2024.
- Localized content, languages, and payment methods are now standard in emerging-market strategies for major developers.
- Install-to-subscription conversion rates are highest in Southeast Asia, with the Philippines leading at 14.2%.
- Cross-border payment support via Apple Pay has improved access to paid apps in underserved regions.
- Health, fintech, and education apps see 2–3x higher adoption in developing countries compared to global averages.
- In 2025, 34% of all new App Store downloads will come from emerging markets.
- Indie developers in Africa and Southeast Asia are now 6x more likely to launch freemium apps, due to demand sensitivity.
- App Store featured listings in local markets now reflect regional relevance, increasing discoverability by +40%.
Recent Developments
- Apple’s App Store Commission is under renewed antitrust scrutiny in the U.S. and EU, leading to experimental alternate payment trials.
- Third-party app stores were introduced in the EU under the Digital Markets Act, though adoption remains below 3%.
- Apple added generative AI app category guidelines, regulating tools like AI chat apps, art generators, and music creation tools.
- VisionOS apps for Apple Vision Pro surged, with over 3,800 AR/VR apps launched by Q1 2025.
- New developer tools like Swift Assist and TestFlight AI improved debugging and feedback collection speeds by over 40%.
- Subscription fee transparency tools are now required by Apple, reducing complaint rates by 19% in early trials.
- iOS 18 enhanced App Store personalization, showing app suggestions based on screen time and device context.
- Apple launched Creator Boost, a new tool allowing content creators to co-market apps directly within their social networks.
- App Store ratings now factor in app performance, crash reports, and update frequency, improving the quality bar.
- New environmental impact disclosures were introduced, requiring apps over 1GB to justify their data use and carbon footprint.
Conclusion
The App Store in 2025 stands as a testament to a maturing yet dynamic digital economy. With $138 billion in projected revenue, a surge in subscription-based models, and the emergence of AI-driven app experiences, Apple’s marketplace is evolving fast, but not without challenges. Developers are adapting to privacy-first frameworks, while users are gravitating toward more transparent, personalized, and engaging app ecosystems. The growth in emerging markets and regulatory changes signal a more decentralized and competitive future. Whether you’re building apps or analyzing trends, these numbers don’t just inform—they shape the path forward.
Sources
- https://www.statista.com/topics/1729/app-stores/
- https://www.tekrevol.com/blogs/apple-app-store-statistics/
- https://www.statista.com/statistics/1020964/apple-app-store-app-releases-worldwide/
- https://buildfire.com/app-statistics/
- https://www.businessofapps.com/data/apple-app-store-statistics/
- https://42matters.com/ios-apple-app-store-statistics-and-trends
- https://meetanshi.com/blog/shopify-app-store-statistics/
- https://mac.eltima.com/app-store-stats/


