WHAT WE HAVE ON THIS PAGE
- Editor’s Choice
- Global SEO Usage Trends in 2025
- Google’s Share in the Search Engine Market
- Key Components of Google’s Ranking Algorithm
- Impact of Core Web Vitals on SEO Rankings
- Mobile-First Indexing and Its Influence on SEO
- Google Search Intent by Query Volume
- Voice Search Optimization Statistics
- Click-Through Rates by Google SERP Position
- Google Organic CTR Breakdown by Position
- Local SEO Statistics
- Local SEO Conversion Stats
- Top Review Platforms Consumers Use for Local Businesses
- Local SEO Statistics for Voice Search
- Role of AI and Machine Learning in Google SEO
- Most Web Pages Get Zero Google Traffic
- Google Algorithm Update Frequency and Effects
- Average Content Length and Ranking Correlation
- Top Challenges Faced by SEO Professionals
- Video SEO Statistics
- SEO Conversion Rate Benchmarks Across Industries
- Organic vs Paid Search Traffic Statistics
- Link-Building Strategies and Their Effectiveness
- Ranking Statistics
- Recent Developments in Google SEO (2024–2025)
- Conclusion
- Sources
In the early days of the internet, simply having a website was enough. Then came search engines. And soon after, the question every business had to answer: Can people find us on Google? Fast forward to 2025, and the world of Google SEO has transformed into a dynamic, data-driven battleground where ranking well means more than just visibility—it means survival in an increasingly digital-first economy.
Whether you’re a local bakery or a Fortune 500 company, SEO has become a pillar of digital strategy. In this report, we unpack the latest Google SEO statistics for 2025, offering a clear view of how search behavior, Google’s algorithms, and SEO tactics are evolving so you can stay ahead of the curve.
Editor’s Choice
Here are the standout SEO statistics for 2025 you shouldn’t miss:
- 92.6% of all search engine traffic in 2025 flows through Google, maintaining its dominance despite growing AI tools and new search competitors.
- 68% of online experiences begin with a search engine—Google continues to lead that journey.
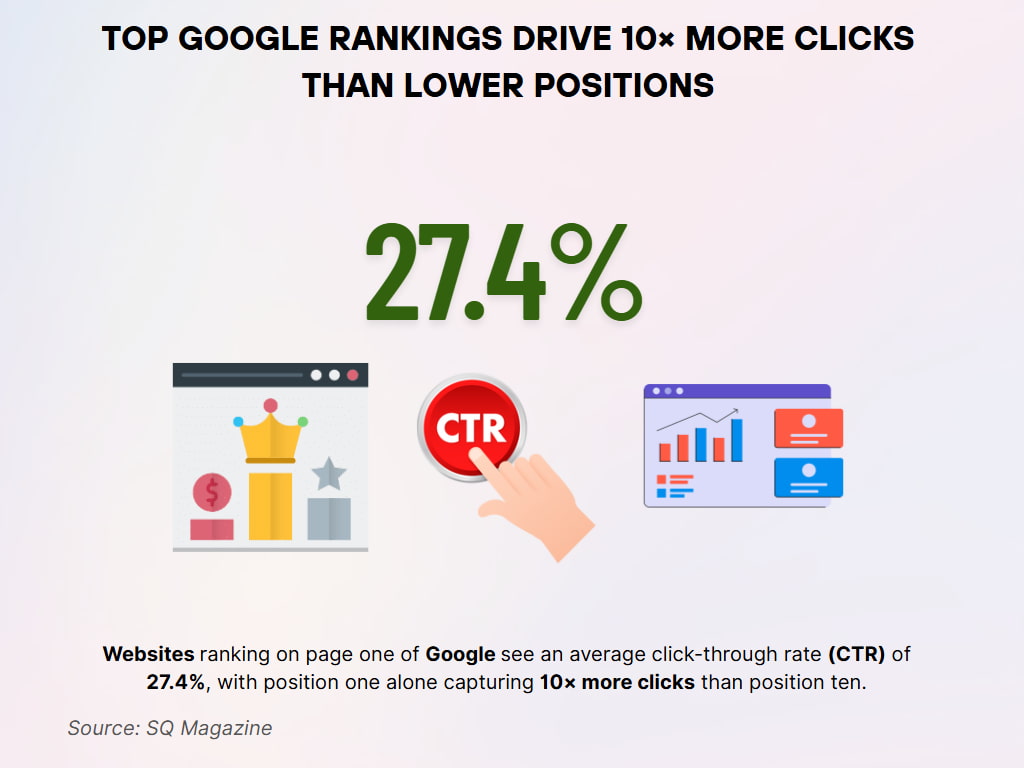
- Websites ranking on page one of Google see an average click-through rate (CTR) of 27.4%, with position one alone capturing 10× more clicks than position ten.
- Mobile-first indexing now impacts 100% of websites indexed by Google, making mobile optimization a non-negotiable SEO requirement.
- Voice search accounted for 21.7% of all Google queries in 2025, up from 17.3% in 2023.
- Google’s last major algorithm update in March 2025 impacted 53% of indexed domains, making it one of the most significant changes in recent years.
- Businesses that publish long-form content (2,000+ words) rank in the top 5 positions 56% more often than those with short-form content.
Global SEO Usage Trends in 2025
- In 2025, global businesses are spending an estimated $127.5 billion on SEO services, up 16% from 2024.
- Over 64% of marketing teams worldwide consider SEO their highest ROI digital channel.
- 72% of companies with an SEO strategy are actively investing in AI-powered tools to support keyword tracking, content optimization, and reporting.
- The number of active SEO agencies globally surpassed 13,000 this year, signaling heightened demand for professional optimization services.
- Organic search drives 53.1% of all website traffic globally, with paid search generating 15.7% and direct traffic 25.6%.
- Nearly 88% of B2B marketers say they will use SEO as part of their content marketing strategy in 2025.
- 79% of SEO professionals now track search intent as a ranking factor, compared to only 52% in 2022.
- The average business website receives 33% more traffic from Google search in 2025 compared to 2023, driven by smarter content structuring.
- More than 58% of global e-commerce companies are now implementing structured data markup to boost SERP visibility.
- Visual search queries—powered by image uploads—are growing at a rate of 31% YoY, particularly in the fashion and home decor industries.
- Google controls 92.6% of the search engine market globally as of Q1 2025.
- In the United States, Google’s market share is 90.8%, with Bing trailing at 5.1% and DuckDuckGo holding 1.6%.
- On mobile devices, Google’s share is even higher—95.2% of all mobile searches happen on Google platforms.
- Chrome browser accounts for 64.7% of desktop and mobile browsing, feeding directly into Google’s search dominance.
- In emerging markets like India and Brazil, Google’s search usage has grown by 14.2% year-over-year, driven by Android accessibility.
- The Google app now holds 1.5 billion monthly active users, reinforcing its role beyond just desktop search.
- Google Lens is used in 12 billion queries annually, marking a sharp rise in visual search dependency.
- Voice-activated Google searches on Android have increased by 21.3% since 2023.
- Google Discover now drives traffic to over 800 million websites monthly.
- Despite new competition from AI search engines and chatbots, trust in Google’s result accuracy remains high at 89% among surveyed users.
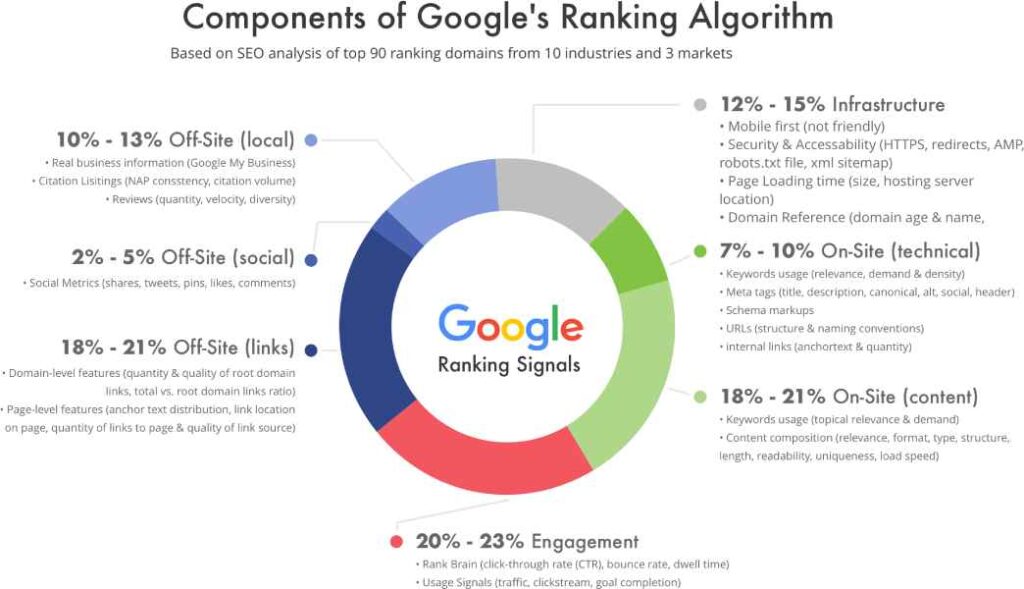
Key Components of Google’s Ranking Algorithm
- Off-Site Social (2% – 5%)
Social proof via shares, likes, comments, and tweets contributes modestly to SEO value. - Engagement (20% – 23%)
Click-through rate (CTR), bounce rate, and dwell time matter most. Google uses RankBrain and usage signals like traffic and goal completions. - Off-Site Links (18% – 21%)
Strong domain-level link quality and quantity play a huge role. Anchor text, link location, and link sources also impact rankings. - On-Site Content (18% – 21%)
Topical relevance, content structure, readability, and uniqueness are critical. Speed and length also influence visibility. - Infrastructure (12% – 15%)
Mobile friendliness, HTTPS, loading speed, domain age, and technical setup (sitemaps, redirects) all contribute to ranking. - Off-Site Local (10% – 13%)
Google My Business, NAP consistency, citations, and review metrics are vital for local SEO. - On-Site Technical (7% – 10%)
Importance of schema, meta tags, URL structure, and internal linking. Proper keyword placement boosts discoverability.
Impact of Core Web Vitals on SEO Rankings
- Websites that score “Good” on all three Core Web Vitals metrics (LCP, FID, CLS) are 34% more likely to rank in the top 10 of Google SERPs.
- The average LCP (Largest Contentful Paint) for top-performing sites is 2.1 seconds, well below the recommended 2.5 seconds.
- Google began weighing Interaction to Next Paint (INP) more heavily in March 2025, replacing First Input Delay (FID).
- Sites with a CLS (Cumulative Layout Shift) of under 0.1 see a 17% higher average page engagement.
- 78% of web developers surveyed in 2025 said they prioritize Core Web Vitals during each deployment.
- eCommerce sites that passed Core Web Vitals saw a 22.8% increase in revenue from organic traffic compared to those that didn’t.
- Poor Core Web Vitals scores result in a 43% higher bounce rate, particularly on mobile-first websites.
- Google now highlights fast-loading pages with a “Page Experience” badge on mobile SERPs.
- AMP pages are seeing diminishing impact on rankings, with Google emphasizing real user experience metrics instead.
- Sites failing Core Web Vitals benchmarks are 15% less likely to appear in Google Top Stories.
Mobile-First Indexing and Its Influence on SEO
- As of 2025, 100% of websites in Google’s index are now based on mobile-first crawling.
- Mobile-optimized sites experience 48% lower bounce rates compared to desktop-optimized versions.
- 66% of all Google search traffic comes from mobile devices.
- Mobile page speed improvements of just 0.5 seconds lead to a 9.7% increase in conversion rates.
- Sites without mobile responsiveness see a drop of 27% in organic traffic after six months.
- Google’s Mobile-Friendly Test API was used over 23 million times in the past 12 months.
- Nearly 3 in 4 users say they are unlikely to return to a site that isn’t mobile-friendly.
- Mobile-first indexing has led developers to prioritize responsive frameworks like Bootstrap and Tailwind CSS.
- Progressive Web Apps (PWAs) are seeing a 25% adoption rate among content-heavy platforms due to mobile SEO benefits.
- Pages that use mobile pop-ups (interstitials) excessively are still penalized under Google’s mobile usability guidelines.
Google Search Intent by Query Volume
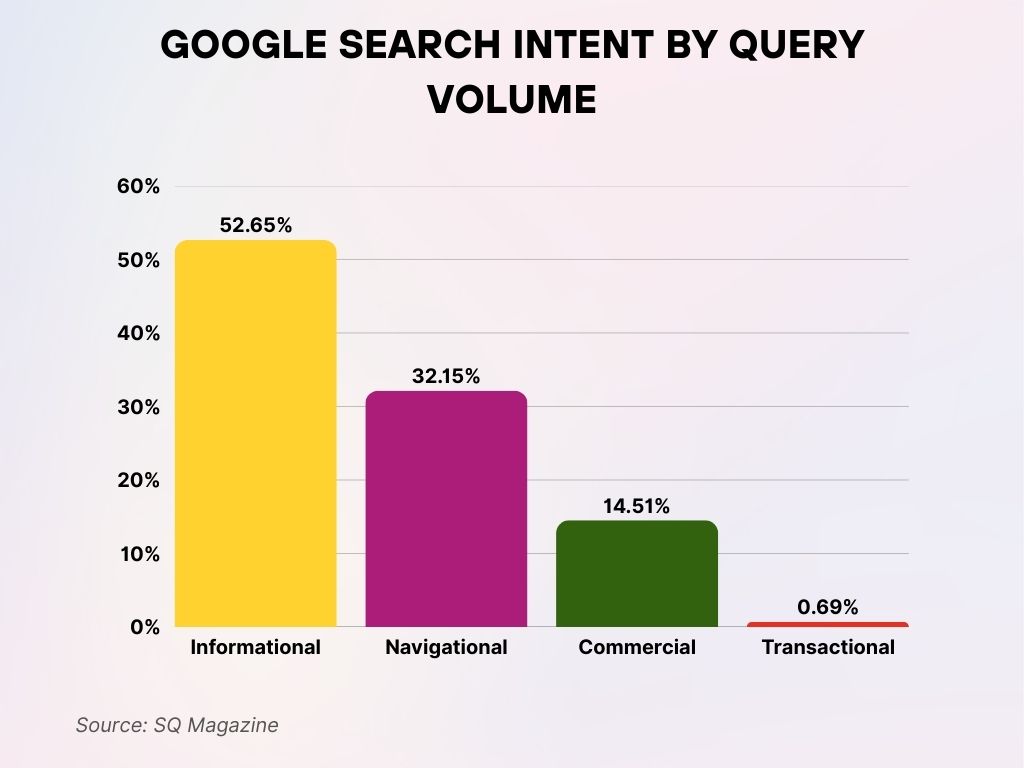
- Transactional searches only account for 0.69% of keyword volume. These users are ready to take action—buying, signing up, or making a conversion.
- Informational searches account for 52.65% of all keyword queries on Google. This shows that most users are looking to learn or understand something, not necessarily make a purchase.
- Navigational intent makes up 32.15% of search volume. These queries are typically aimed at finding a specific website, app, or brand.
- Commercial intent represents 14.51% of searches. Users with this intent are usually in the consideration phase, researching before buying.
Voice Search Optimization Statistics
- Voice searches now account for 21.7% of total Google queries in 2025, up from 17.3% in 2023.
- 70% of voice search results come from the top three positions in Google SERPs.
- The average voice search result is only 29 words long, emphasizing concise content formatting.
- Voice search is most popular among users aged 18–34, making up 54% of the demographic usage.
- Near me voice searches have grown by 31% YoY, with restaurants and service businesses seeing the highest conversion rates.
- Featured snippets will power 60% of voice search results in 2025.
- FAQ schema usage on websites has grown by 44% due to its importance in voice response generation.
- Pages optimized for voice search load 52% faster than the average page.
- The smart speaker market in the US now reaches 94.5 million users, heavily influencing voice search behavior.
- Conversational keywords (e.g., “how,” “best way to”) are appearing in 22% more top-ranking results compared to last year.
Click-Through Rates by Google SERP Position
- In 2025, the first organic result on Google earns an average click-through rate (CTR) of 27.4%.
- The second position garners 15.6% CTR, while the third drops to 11.0%, showing a steep visibility decline down the rankings.
- Results in positions 7 to 10 collectively account for less than 5% of all clicks.
- Google SERPs with featured snippets reduce clicks to the top organic listing by 8–10%.
- The “People Also Ask” (PAA) box appears in 57.9% of Google queries and often diverts user clicks.
- Branded search queries have a CTR of 42.2%, outperforming non-branded ones significantly.
- Pages with structured data markup increase CTR by 14.8% on average.
- Pages with emojis in titles have a 5.3% higher CTR in select niches like entertainment and lifestyle.
- Desktop users have a 19% higher likelihood of clicking on the first link compared to mobile users.
- Rich results (e.g., star ratings, images) appear in 39.7% of all Google listings, boosting engagement substantially.
Google Organic CTR Breakdown by Position
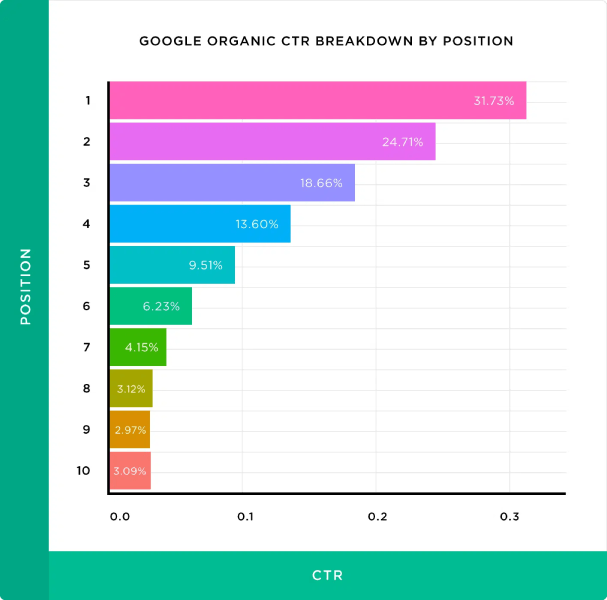
- Position 10 receives only 3.09% CTR, underscoring the importance of being on top to capture meaningful traffic.
- Position 1 gets the highest CTR at 31.73%
This highlights the massive advantage of ranking first on Google search results for maximum organic clicks. - Position 2 captures 24.71% CTR, a significant drop from the top spot. Still, it retains strong visibility and click potential.
- Position 3 earns 18.66% CTR, showing decent engagement but notably less than the top two results.
- Position 4 sees a CTR of 13.60%, falling into mid-tier visibility on the page.
- Position 5 gets 9.51% CTR, nearly a third of what the first spot receives.
- Position 6 drops to 6.23% CTR, demonstrating a continued decline in user attention down the SERP.
- Position 7 records just 4.15% CTR, reflecting limited engagement past the halfway mark.
- Position 8 secures 3.12% CTR, nearing the bottom of the page with reduced clicks.
- Position 9 has a 2.97% CTR, highlighting minimal traffic as users rarely scroll this far.
Local SEO Statistics
- 46% of all Google searches in 2025 have local intent, such as “near me” queries.
- Businesses with a verified Google Business Profile receive 2.7× more engagement than unclaimed listings.
- Local searches drive 78% of mobile users to visit a store within 24 hours.
- 97% of users learn more about a local business online than anywhere else.
- Listings with 4+ star ratings get 58% more clicks than those with fewer ratings.
- Local businesses that respond to reviews within 24 hours experience a 12% increase in conversion rates.
- Photos on Google Business Profiles lead to 42% more direction requests and 35% more website clicks.
- Businesses with a blog on their site receive 126% more leads from local searches.
- The use of hyperlocal keywords like neighborhood names has grown by 33% YoY.
- 52% of local businesses now use tools like Moz Local, BrightLocal, or Yext to automate SEO efforts.
Local SEO Conversion Stats
- The average conversion rate for local searches is 19.2%, more than double the rate of non-local organic visits.
- Businesses appearing in the Google Local 3-Pack see 70% of all local search clicks.
- Mobile local search converts 22% of the time, especially for service-based businesses.
- Listings with real-time updates (like open hours and events) convert at 2.1× higher rates.
- Industries with the highest local conversion rates include legal (27.1%), home services (25.3%), and medical (24.6%).
- 60% of consumers say they’re more likely to contact a business with recent photos and review responses.
- Local landing pages with embedded Google Maps convert 23% better than those without.
- Using click-to-call buttons increases conversion by 32% on mobile local listings.
- Listings optimized with FAQs and schema see 40% higher conversions for voice queries.
- Google’s introduction of “Order with Google” for restaurants has improved online ordering conversion by 18.4%.
Top Review Platforms Consumers Use for Local Businesses
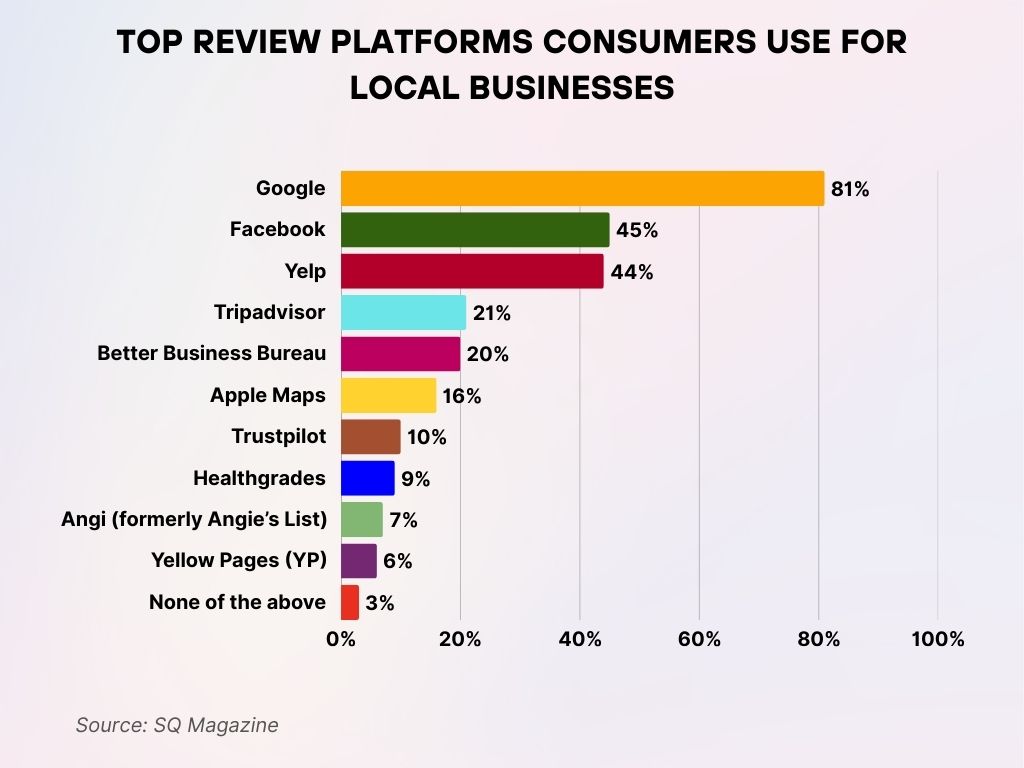
- 3% selected ‘None of the above’, indicating a small portion either don’t use review sites or rely on other sources.
- Google leads with 81% of consumers using it to evaluate local businesses. It remains the dominant platform for trust and visibility.
- Facebook is used by 45% of consumers. Social proof through comments and reviews on business pages plays a major role.
- Yelp comes close with 44% usage. Its long-standing reputation for reviews makes it a go-to for detailed feedback.
- TripAdvisor is trusted by 21% of consumers. It’s especially influential in the travel, hospitality, and restaurant sectors.
- 20% rely on the Better Business Bureau, showing that credibility and accreditation still matter to a good portion of users.
- Apple Maps is used by 16%, likely due to iOS integration and built-in local recommendations.
- Trustpilot has 10% of users turning to it for reviews, primarily for product and service verification.
- Healthgrades captures 9%, a key source for consumers researching healthcare providers.
- Angi (formerly Angie’s List) is used by 7%, especially for home services and contractors.
- Yellow Pages (YP) still sees 6% of consumer usage, proving it retains some relevance despite being a legacy platform.
Local SEO Statistics for Voice Search
- 53% of smart speaker users perform local voice searches weekly.
- The most requested categories via voice include food delivery, local services, and event directions.
- Voice queries that include phrases like “open now” or “near me tonight” have grown by 38% YoY.
- Businesses with local voice optimization see a 20% increase in phone calls from voice-driven results.
- Voice queries result in a higher intent to convert, with 76% of users calling or visiting a location within a day.
- Pages optimized for mobile and fast loading speed have a 64% higher chance of being selected for voice results.
- Adding business hours, address, and directions schema helps Google better match voice queries to local intent.
- 46% of all voice searches target a local business, a stat projected to increase in the next 2 years.
- The use of natural language and question-based headings boosts visibility for voice-local SEO by 28%.
Role of AI and Machine Learning in Google SEO
- Google’s Search Generative Experience (SGE) now influences results for over 31% of all queries in the US.
- Machine learning-based updates are rolled out continuously, with 1,200+ changes to Google Search made annually.
- BERT, MUM, and now Gemini AI are driving contextual understanding and relevance in results.
- SEO tools like Surfer SEO, Clearscope, and Frase saw a 61% growth in adoption due to AI-powered optimization features.
- AI-generated content now accounts for 22.5% of new web pages created each month, though Google favors human-reviewed content.
- Top-ranking content is increasingly created using a mix of AI-assisted writing and editorial refinement.
- Predictive search queries powered by AI influence 60% of mobile searches via autocomplete.
- Marketers using AI for content gap analysis are 2.3× more likely to outperform competitors in SERPs.
- Google’s SpamBrain AI system blocked 99% of link spam attempts in 2024 and continues improving in 2025.
- Real-time AI-driven SERP adjustments have decreased ranking volatility by 17% compared to 2023.
Most Web Pages Get Zero Google Traffic
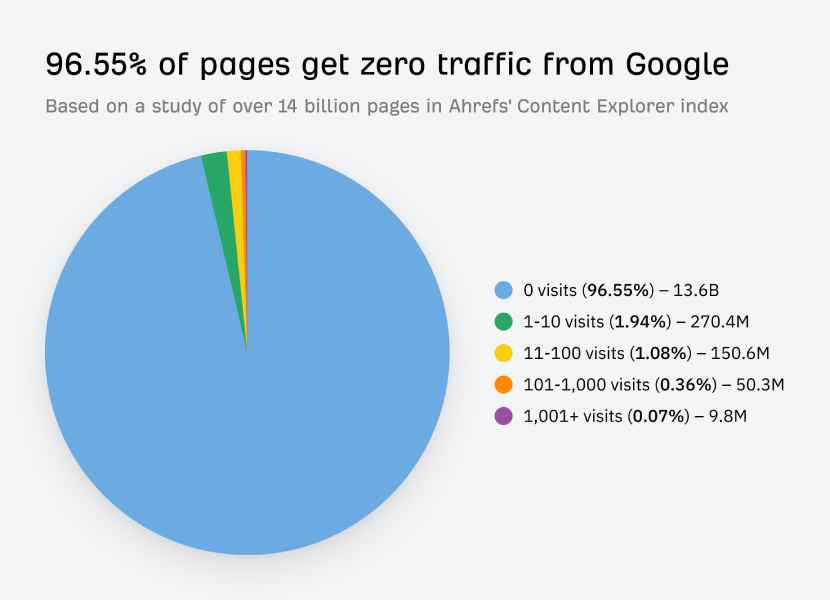
- Just 0.07% of pages get over 1,000 visits, equal to 9.8 million pages. This tiny group dominates search traffic, highlighting how competitive rankings really are.
- 96.55% of pages receive 0 visits from Google, totaling a staggering 13.6 billion pages. This shows how difficult it is for most content to gain visibility in search.
- 1.94% of pages get only 1–10 visits, representing 270.4 million pages. Even minimal traffic is rare for the majority of indexed content.
- 1.08% of pages receive 11–100 visits, which adds up to 150.6 million pages. These are slightly more discoverable but still far from high-performing.
- Only 0.36% of pages generate 101–1,000 visits, accounting for 50.3 million pages. These pages show modest traction in search.
Google Algorithm Update Frequency and Effects
- In 2024–2025, Google released 11 confirmed broad core algorithm updates, with dozens more unconfirmed tweaks.
- The March 2025 Core Update impacted 53% of websites, focusing on helpful content and user engagement metrics.
- Sites with thin content experienced an average ranking drop of 19% post-update.
- Spam policies, particularly targeting AI-generated low-quality pages, were tightened in January 2025.
- Recovery from a major update takes between 2 to 5 months, depending on site size and remediation speed.
- The Helpful Content System, introduced in late 2024, continues to demote “search-engine-first” content.
- Link relevance is now more weighted than link volume, following updates in Google’s off-page ranking signals.
- Pages with high E-E-A-T (Experience, Expertise, Authoritativeness, and Trustworthiness) remain more resistant to ranking drops.
- Medical, finance, and legal sites (YMYL) were the industries most affected by algorithm changes in 2025.
- Rank tracking volatility reached a high in April 2025 with a 15.2% spike, indicating another possible silent update.
Average Content Length and Ranking Correlation
- The average word count of a first-page Google result in 2025 is 2,184 words.
- Long-form content (2,000+ words) outranks short-form by a margin of 56%.
- Pages with unique visuals and internal links tend to outperform those that rely solely on text.
- Listicles and how-to articles are 38% more likely to appear in Google’s featured snippets.
- Articles that include FAQs, tables, and bulleted data see a 32% higher engagement rate.
- Content updated in the last 90 days performs 24% better than older, static content.
- Semantic keyword optimization (using related terms and LSI phrases) increases average ranking by 12 spots.
- Posts with embedded videos rank on the first page 53% more often than text-only content.
- Adding author bios and sourcing improves ranking potential, especially for YMYL pages.
- The average reading level of top-performing content is at 9th grade, supporting clarity and digestibility.
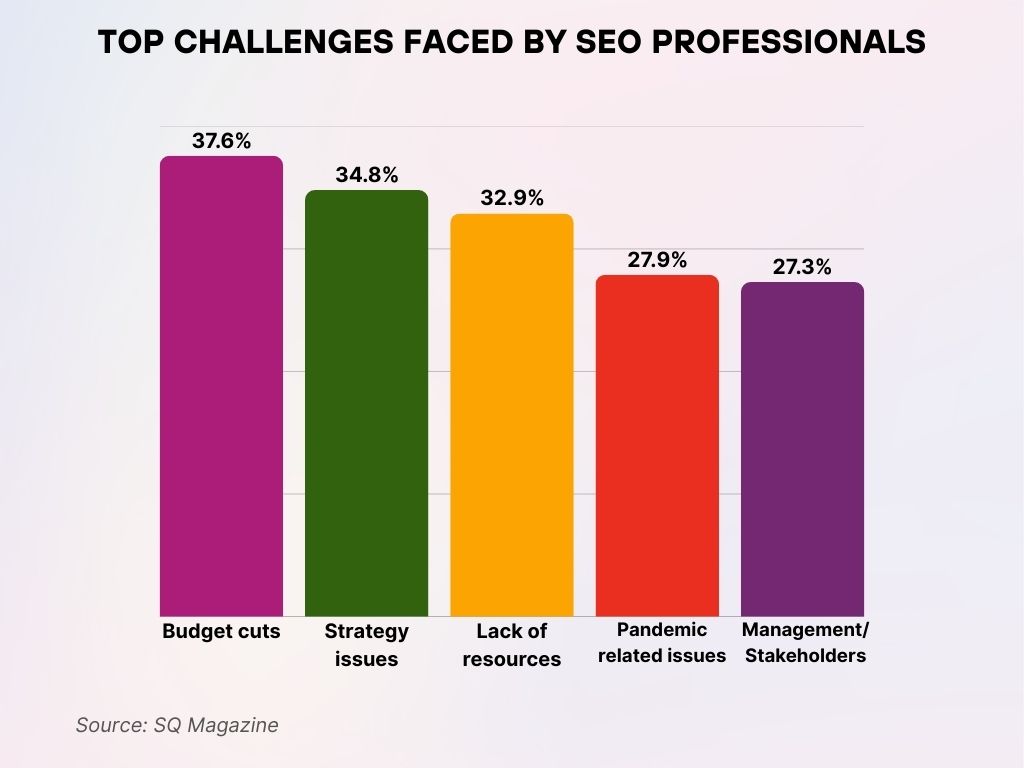
Top Challenges Faced by SEO Professionals
- Management or stakeholder challenges affect 27.3% of SEO pros. Misalignment or lack of understanding from leadership can delay or derail SEO progress.
- Budget cuts are the biggest challenge, reported by 37.6% of SEO professionals. Limited funding restricts tool access, campaign scalability, and hiring capacity.
- Strategy issues affect 34.8% of professionals. Many teams struggle with aligning SEO plans to broader marketing or business objectives.
- 32.9% cite a lack of resources as a key barrier. This includes time, personnel, and access to necessary SEO tools and technologies.
- Pandemic-related issues still impact 27.9% of respondents. Shifting consumer behavior and disrupted workflows have lingering effects on SEO execution.
Video SEO Statistics
- Video content appears in 28.6% of Google search results on page one, up from 22.1% in 2023.
- YouTube videos dominate video carousels, accounting for 89% of all indexed video content on SERPs.
- Pages with embedded videos see a 41% increase in average session duration and 34% lower bounce rates.
- 92% of marketers using video for SEO say it has improved their organic traffic.
- Video thumbnails improve CTR by 18–22%, depending on the query and industry.
- “How-to” videos are the most frequently featured in Google’s video carousel, making up 43.7% of all listings.
- Transcribed and captioned videos rank 2.1x higher than those without accessible text content.
- Short-form videos (under 2 minutes) now perform better in mobile searches due to Google Web Stories integration.
- Video content increases the chance of earning a featured snippet by up to 26%.
- Brands that post consistent video content on YouTube experience a 157% boost in indexed pages within 6 months.
SEO Conversion Rate Benchmarks Across Industries
- The average SEO conversion rate across all industries in 2025 is 2.9%, with significant variations by niche.
- Legal services hold the top spot at 7.6%, followed by financial services at 6.1%, and education at 4.3%.
- E-commerce SEO leads to 2.2% conversion rates on average, but luxury and niche segments perform much better.
- Healthcare websites see a conversion rate of 4.8%, particularly for appointment-based keywords.
- B2B SaaS companies experience a 3.5% conversion rate from organic search, with demo-related queries converting at 5.2%.
- Blogs that target bottom-of-funnel keywords convert at 2.8× higher rates than those focused solely on awareness content.
- Landing pages with schema markup and rich snippets convert at a rate 16% higher than pages without.
- Local service providers with SEO-optimized sites see average leads convert at 19.5%, driven by high-intent searches.
- Pages with live chat widgets convert at 2.1× the rate of those with only static contact forms.
- Industries with low SEO conversion rates include media (0.8%), hospitality (1.4%), and fashion retail (1.9%).
Organic vs Paid Search Traffic Statistics
- Organic search drives 53.1% of total web traffic globally, while paid ads account for 15.7%.
- The average cost per click (CPC) for Google Ads has increased to $2.89, making SEO a more sustainable channel in the long term.
- SEO delivers 2.6× higher ROI than paid search over a 12-month period.
- 76% of users report that they scroll past ads to reach organic results.
- Paid search captures 58% more clicks for branded queries, but organic dominates on long-tail informational searches.
- Sites appearing in both organic and paid listings enjoy a double visibility lift, increasing total clicks by 26%.
- Organic leads convert 2.4x higher than PPC leads in industries with long sales cycles.
- 41% of marketers reduced their paid ad budget in 2025 in favor of content-driven SEO strategies.
- Mobile CTR for paid search decreased by 13% YoY due to ad fatigue and layout changes.
- Organic traffic is the top-performing acquisition channel for 74% of high-growth SaaS startups.
Link-Building Strategies and Their Effectiveness
- Backlinks remain among the top three ranking factors, with quality over quantity being more critical than ever.
- Pages ranking #1 have an average of 3.8x more backlinks than pages in positions 2–10.
- Guest blogging and expert roundups are still highly effective, with a 27% success rate in link acquisition.
- Broken link building generates an average 7.5% response rate, with niche industries seeing better results.
- Digital PR campaigns drive 3.2x more high-authority backlinks than traditional outreach.
- Unlinked brand mentions are being converted to backlinks by 42% of marketers using automated monitoring tools.
- Pages that include original research or data studies earn 24% more backlinks than general opinion content.
- Skyscraper content receives 197% more backlinks on average when paired with targeted outreach.
- Linkable assets like free tools, templates, and calculators are producing 38% higher link ROI in 2025.
- Google’s updated link spam policy now devalues links from low-quality directories and PBNs more aggressively than before.
Ranking Statistics
- Only 0.63% of searchers click on results from the second page of Google.
- The average time to rank in the top 10 positions is 3.8 months for new content with proper optimization.
- Domains with high topical authority rank 2.7x faster than newer, generalized websites.
- HTTPS, mobile usability, and page speed are now table stakes—lacking these results in up to 32% traffic loss.
- Exact-match domains (EMDs) have lost relevance; instead, brand authority and semantic context now drive rankings.
- Pages with original images outperform stock-photo-heavy content by 12% in SERPs.
- Adding internal links to cornerstone pages improves their rank by up to 15 positions within 30 days.
- Domain age has a limited impact—site freshness and update frequency matter more for 2025 ranking.
- Featured snippets were displayed for 19.4% of all queries, with list-based formats favored most.
- Top-ranking pages optimize for an average of 18 semantically related keywords, not just the primary target.
Recent Developments in Google SEO (2024–2025)
- Google’s March 2025 Core Update introduced INP (Interaction to Next Paint) as a key ranking signal, replacing FID.
- The Search Generative Experience (SGE) continues its phased rollout and now influences nearly 1 in 3 searches.
- Google introduced AI Overviews, which blend AI summaries with traditional search results, creating a hybrid experience.
- Passage indexing improvements help rank specific sections of long-form content, enhancing relevance for niche queries.
- The Web Stories format now contributes to top results for mobile-first content, especially in lifestyle and travel.
- Google Maps added search themes, grouping local businesses based on user intent—impacting local SEO strategies.
- Updates to the Helpful Content System penalize thin affiliate content and AI-generated pages with no editorial oversight.
- Voice search integration with Android Auto and Google Home has made voice SEO a growing priority.
- Google now supports the IndexNow protocol for instant URL indexing, which has been adopted by over 3 million websites.
- Structured data expansion includes pros/cons schema, offering richer snippets and better click-through performance.
Conclusion
As we move through 2025, SEO is no longer about simply adding keywords to a page or collecting backlinks at scale. It’s about understanding user intent, delivering fast and engaging experiences, and leveraging tools like AI and structured data to align with Google’s evolving algorithms.
Businesses that adapt to changes—like voice search, Core Web Vitals, video integration, and AI-enhanced content creation—stand to win the visibility battle. Meanwhile, those ignoring these shifts may find themselves buried under better-optimized competitors.
Whether you’re a startup looking to grow or a legacy brand aiming to hold your ground, the key takeaway is this: Google SEO in 2025 rewards depth, relevance, and user-centered strategy above all.
Sources
- https://backlinko.com/seo-stats
- https://www.digitalsilk.com/digital-trends/top-google-statistics/
- https://aioseo.com/seo-statistics/
- https://digitalmarketinginstitute.com/blog/12-of-the-most-important-seo-statistics-to-know
- https://www.thinkwithgoogle.com/marketing-strategies/search/google-my-business-seo-statistics/
- https://www.statista.com/statistics/1402871/focus-areas-seo-worldwide/
- https://www.seo.com/blog/local-seo-statistics/
- https://www.searchlogistics.com/learn/statistics/digital-marketing-statistics/


