It started with a click. A teenager in California, booting up their tablet before school. A retiree in Florida is checking the news. A developer in New York is toggling between dozens of browser tabs. Today, web browsers are more than digital doors to the internet, they are our gateways to productivity, privacy, and personal expression. As technology evolves and user priorities shift, understanding how we browse in 2025 offers critical insights into digital behavior, market leadership, and the ongoing tug-of-war between convenience and control.
Whether you’re a marketer, developer, or just someone curious about the digital tools shaping our lives, these browser usage stats for 2025 will give you the context you need to stay ahead.
Editor’s Choice
- Google Chrome remains the dominant browser globally, accounting for 62.1% of total web usage as of Q1 2025.
- Safari holds a strong second place, with a global market share of 19.2%, thanks largely to iOS devices.
- Microsoft Edge increased its presence, securing 6.5% of the market, up from 5.8% in 2024.
- The mobile browser segment now contributes to over 59% of total browser activity worldwide.
- Privacy-focused browsers like Brave and DuckDuckGo collectively captured 2.4% of the market, marking a 34% year-over-year increase.
- The share of desktop browser use dropped to 35.6%, down from 39.8% last year.
- Over 1.2 billion people now use browser extensions to block ads or enhance privacy.
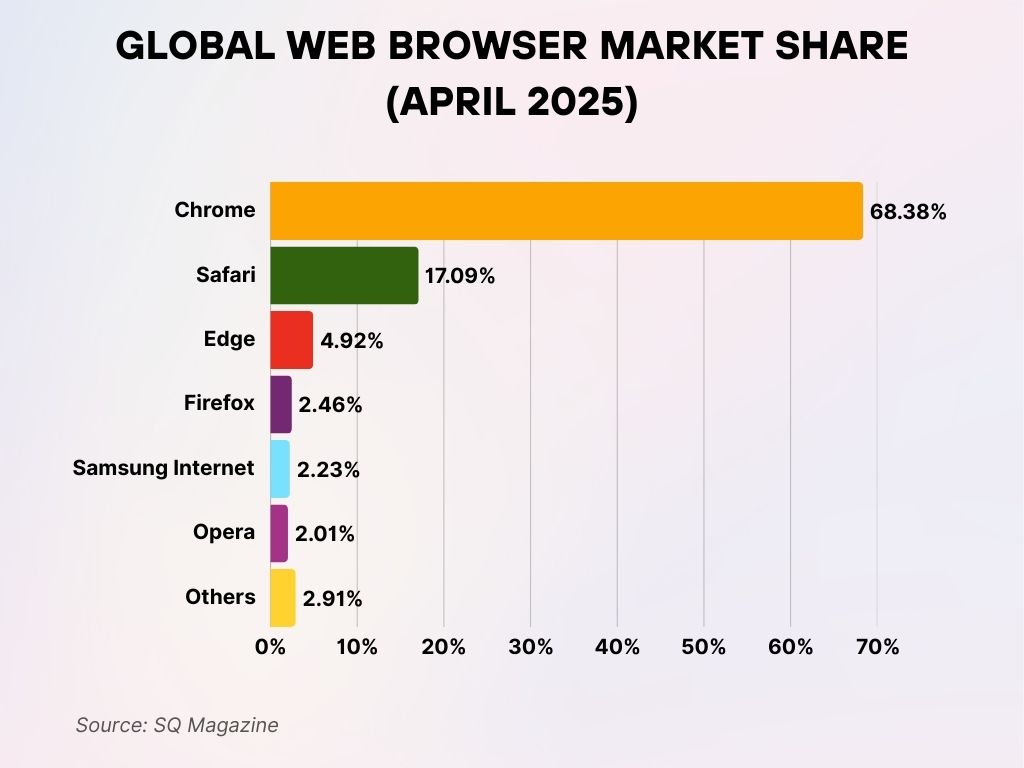
Global Web Browser Market Share (April 2025)
- Google Chrome dominates the market with a 68.38% share, maintaining its stronghold as the world’s most popular browser.
- Safari holds the second spot, capturing 17.09% of global usage, largely driven by Apple device users.
- Microsoft Edge secures a modest 4.92% market share, reflecting slow but steady adoption.
- Firefox remains a niche favorite with a 2.46% share, valued by users who prioritize privacy.
- Samsung Internet holds 2.23%, mainly supported by mobile users on Samsung devices.
- Opera claims 2.01%, thanks to its built-in VPN and data-saving features.
- Other browsers collectively make up 2.91%, showing the long tail of browser diversity in the market.
Web Browser Usage by Device Type (Desktop, Mobile, Tablet)
- Mobile browsers now dominate with a 59.3% share of global web traffic.
- Desktop usage accounts for 35.6%, showing a continued decline in traditional PC browsing.
- Tablet-based browsing contributes 5.1%, slightly up from 4.7% in 2024.
- Safari leads on mobile with a 23.4% market share, due to iPhone and iPad integration.
- Chrome maintains dominance across all device types, with over 48% on mobile and 70% on desktop.
- Edge has a higher share on desktops (11.3%) than on mobile, where it remains below 1.5%.
- Tablet usage in education and eldercare sectors increased browser interaction on devices like iPads and Kindles.
- In North America, mobile browser usage among Gen Z is now at 72%, compared to 51% for Gen X.
- Voice-controlled browsing is on the rise in tablets and mobile, with usage up 19% year-over-year.
Regional Trends in Browser Popularity
- In the United States, Chrome leads with 53.7%, followed by Safari at 31.4%.
- In Europe, Firefox holds a stronger position at 5.9%, more than double its US share.
- Safari dominates in Japan, with a market share of 47%, thanks to the country’s high iPhone penetration.
- In India, Chrome is overwhelmingly used by 82.3% of users, driven by Android device adoption.
- Samsung Internet ranks second in Indonesia, with 14.6% of users preferring it over Chrome.
- In Africa, Opera still enjoys a 7.2% market share, favored for its data-saving features.
- Brave is gaining traction in Germany and Switzerland, where privacy regulation is strict.
- In Brazil, Edge saw a 20% year-over-year increase in desktop usage, partly due to Microsoft’s education programs.
- China’s browser landscape remains unique, with UC Browser and QQ Browser maintaining visibility despite global declines.
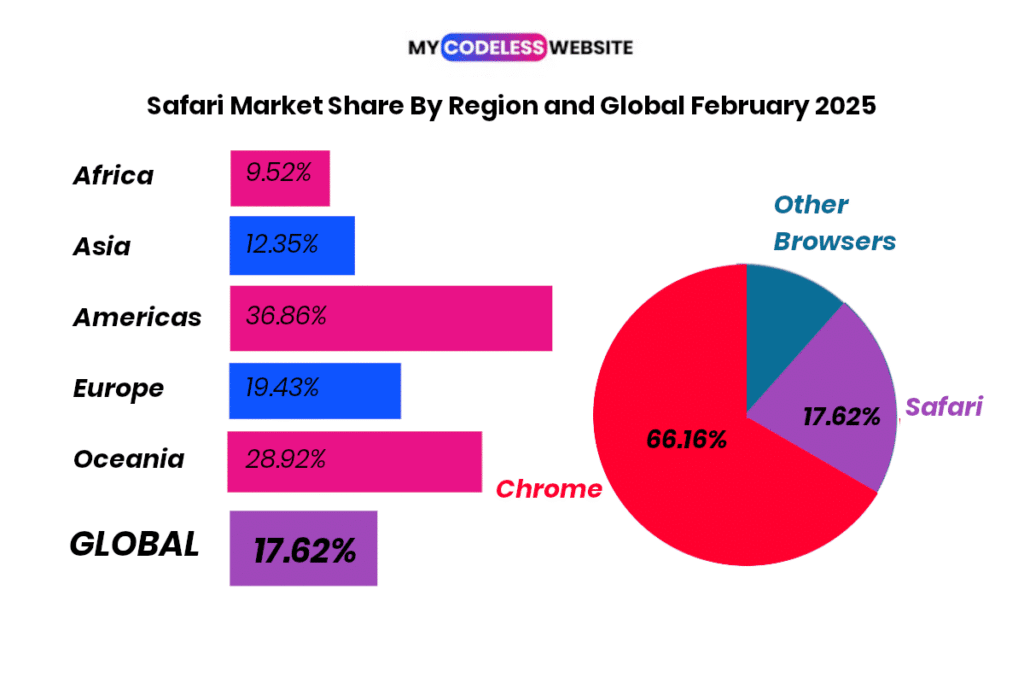
Safari Market Share by Region
- Safari’s global market share stands at 17.62%, positioning it as the second most-used browser worldwide.
- Americas leads in Safari usage with a 36.86% market share, more than double the global average.
- Oceania ranks second regionally with 28.92% Safari usage.
- Europe follows with 19.43%, slightly above the global average.
- Asia shows moderate adoption at 12.35%, while Africa trails with just 9.52%.
- In the global browser market, Chrome dominates with 66.16%, significantly ahead of Safari.
- All other browsers combined account for 16.22% of the global share, just under Safari’s total.
Year-over-Year Browser Growth Comparison
- Chrome saw a 2.4% decline in global usage from 64.5% in 2024 to 62.1% in 2025.
- Safari experienced a 6.1% growth, climbing from 18.1% to 19.2%, driven by iOS adoption in emerging markets.
- Microsoft Edge grew modestly by 12%, moving from 5.8% to 6.5%.
- Firefox usage dropped by 9.6% year-over-year, as user retention continues to be a challenge.
- Brave Browser experienced the highest growth rate, expanding by 34% YoY, as privacy-conscious users shift behavior.
- Opera saw a 6.3% increase in mobile usage in Southeast Asia, where it offers optimized data compression.
- Samsung Internet grew by 2.7%, maintaining a stable share in Samsung’s default browser ecosystem.
- Tablet browsing rose by 8.5% year-over-year, showing signs of a post-pandemic digital habits reset.
- Browser extension installations are up 23% from 2024, a strong signal of user demand for customization.
- Voice-activated browser use across platforms has seen a 21% increase, especially among older adults and multitaskers.
Web Browsers with the Fastest Adoption Rates
- Brave leads in adoption speed, with a 34% YoY growth rate and over 75 million users globally.
- Arc Browser, a new player in the US market, saw a 260% increase in installations in the first quarter of 2025.
- Vivaldi usage rose by 18.9%, especially in developer and tech-savvy communities across Europe and the US.
- DuckDuckGo’s web browser has crossed 15 million active installs, up 22% year-over-year.
- Microsoft Edge on macOS has seen a 14.5% increase, signaling successful cross-platform expansion.
- Kiwi Browser, popular for Chrome extensions on mobile, grew by 16%, especially in India and the Philippines.
- Firefox Focus, a privacy-first mobile browser, is up 12.4%, showing renewed interest in lightweight browsing.
- Orion Browser, available on macOS/iOS, reported a fivefold increase in beta users since late 2024.
- Opera GX, designed for gamers, has seen a 26% rise in usage among Gen Z users globally.
- Puffin Browser, known for its server-based rendering, surged in African nations by 17.2%.
Google Chrome Audience Age Demographics
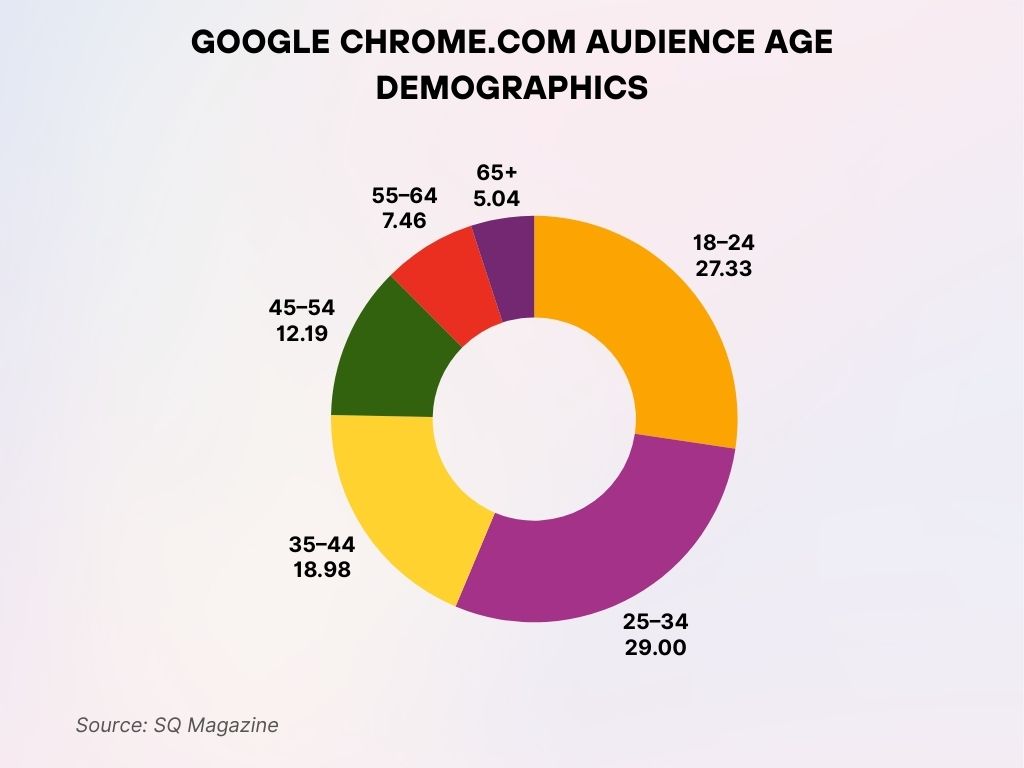
- The largest age group visiting google.com is 25–34 years, making up 29.00% of the total audience.
- Young adults (18–24) are the second most active group, accounting for 27.33% of visitors.
- Users aged 35–44 represent 18.98%, showing steady engagement from mid-career professionals.
- The 45–54 age bracket contributes 12.19%, indicating moderate usage from older adults.
- Chrome sees lower engagement from the 55–64 group at 7.46% and the 65+ group at only 5.04%.
Decline in Legacy or Obsolete Browsers
- Internet Explorer, officially unsupported by Microsoft since 2022, now accounts for less than 0.2% of global usage.
- UC Browser dropped below 1% globally after dominating parts of Asia just five years ago.
- Maxthon and Baidu Browser saw a combined usage decline of 60% year-over-year.
- Netscape Navigator remains extinct, though referenced nostalgically in tech circles.
- In 2025, fewer than 0.5% of enterprise systems will rely on IE compatibility mode.
- Legacy Android stock browsers have fallen below 0.4% due to system updates and OEM restrictions.
- QQ Browser is rapidly losing ground outside China, with a 19% user drop in Southeast Asia.
- Older versions of Firefox and Chrome (pre-2020 builds) now make up less than 0.3% of all tracked sessions.
- Symbian-based mobile browsers are now officially obsolete, with no measurable traffic detected in 2025.
- Java-based web browsers, once embedded in niche enterprise systems, have been phased out entirely.
Browser Usage by Operating System
- On Windows OS, Chrome holds 63% of browser usage, followed by Edge at 24%.
- On macOS, Safari leads with 51%, while Chrome comes in second at 41%.
- For Linux users, Firefox dominates with 39%, while Brave and Vivaldi share a combined 24%.
- On iOS, Safari accounts for over 92% of all browser usage due to system integration and default settings.
- On Android, Chrome leads with 84%, while Samsung Internet holds a solid 12% share.
- Edge’s presence on Linux has grown by 8.7%, due to enterprise testing in sandboxed environments.
- Tablets on iPadOS are using Safari for 68% of sessions, while Chrome accounts for 25%.
- Custom OS devices, such as e-readers or smart displays, tend to use stripped-down or proprietary browsers with negligible traffic.
- Gaming consoles like the Xbox Series X use Edge as the primary browser in 94% of browsing instances.
Most Common Google Chrome Vulnerabilities
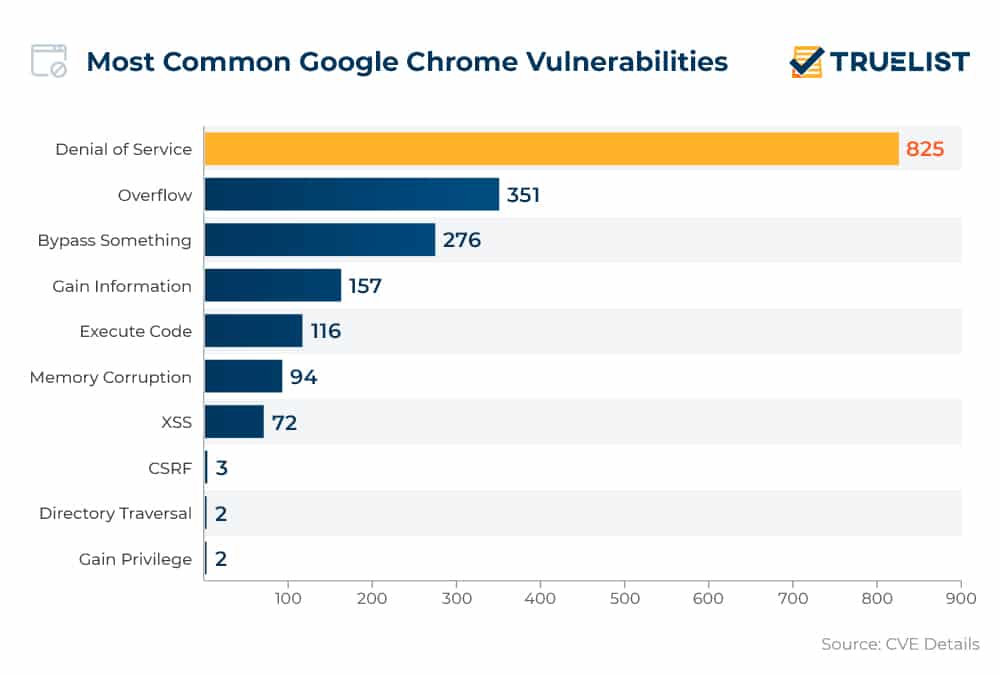
- Denial of Service (DoS) tops the list with 825 reported vulnerabilities, making it the most frequent security issue in Chrome.
- Overflow vulnerabilities come next with 351 cases, posing serious risks for memory-based attacks.
- Bypass-related exploits have occurred 276 times, showing how security measures can be evaded.
- Information Gain vulnerabilities were reported 157 times, potentially exposing sensitive user data.
- Code Execution flaws account for 116 vulnerabilities, allowing attackers to run malicious code.
- Memory Corruption issues follow with 94 cases, often leading to crashes or unexpected behavior.
- Cross-Site Scripting (XSS) has been found 72 times, enabling the injection of malicious scripts.
- Less common issues include CSRF (3), Directory Traversal (2), and Gain Privilege (2), still critical but less frequent.
Privacy and Security Preferences Influencing Browser Choice
- 82% of US users say they consider privacy and data tracking policies before installing a new browser.
- Brave saw an adoption boost after rolling out its AI-powered anti-tracking features in early 2025.
- DuckDuckGo reports a 42% increase in daily browser downloads, citing consumer pushback against data harvesting.
- A 2025 Harris Poll revealed that 67% of Gen Z users would abandon a browser if they discovered it sold anonymized data.
- Firefox’s Enhanced Tracking Protection (ETP) is now enabled by default in 100% of new installations.
- Safari’s “Private Relay” feature is used by 48% of iCloud+ subscribers in North America.
- Edge improved its privacy dashboard interface, contributing to a 16% boost in trust scores among enterprise users.
- 60% of mobile browser users install third-party ad blockers within a month of getting a new device.
- A 2025 Kaspersky report found that 41% of data breaches stem from users running outdated or insecure browsers.
- Privacy-first browsers outperform others on page load time when trackers are blocked, reducing latency by 12% on average.
User Retention and Engagement Rates Across Browsers
- Chrome maintains the highest user retention rate, with 71% of users identifying it as their primary browser for over 12 months.
- Safari follows closely, with a 65% retention rate, particularly strong among Apple ecosystem users.
- Firefox has a 32% active user retention rate, down from 38% in 2024, indicating difficulty in competing with more mainstream browsers.
- Edge users average 5.2 sessions per day, slightly ahead of Chrome’s 4.9, reflecting corporate usage.
- Brave boasts an average session duration of 11.3 minutes, the highest among privacy-first browsers.
- Opera GX users spend an average of 9.7 minutes per session, engaging heavily with gaming-related features.
- Browsers with integrated news feeds or personalization (e.g., Vivaldi) see 16% higher engagement than those without.
- A 2025 Nielsen study found that 52% of users use at least two browsers regularly for different tasks.
- The average number of tabs open across desktop browsers is now 9.8, with Chrome users topping the list at 11.4 tabs.
- Mobile browsers have an average bounce rate of 64%, while desktop browsers show improved engagement at 47%.
Web Browser Market Share in the United States
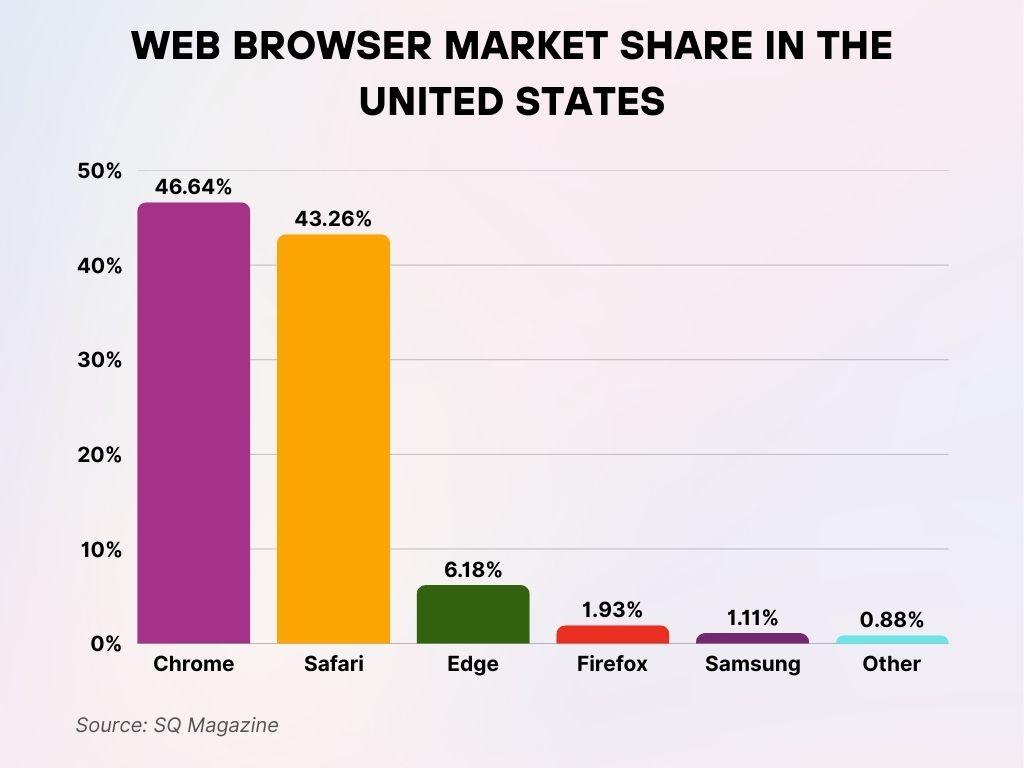
- Google Chrome leads the U.S. browser market with a 46.64% share, reflecting its widespread popularity across platforms.
- Safari closely follows with a 43.26% share, driven by the strong presence of Apple devices.
- Microsoft Edge holds 6.18%, showing modest traction among U.S. users.
- Firefox accounts for just 1.93%, maintaining a niche user base.
- Samsung Internet captures 1.11%, mainly from mobile device users.
- Other browsers combined contribute a minimal 0.88% to the U.S. market.
Impact of Default Browser Settings on Market Share
- 84% of smartphone users globally continue to use the default browser pre-installed on their devices.
- On iOS, Safari’s dominant market share is directly tied to its default status, which accounts for over 90% of usage.
- Chrome benefits similarly on Android, where it’s the default browser on nearly 89% of devices.
- Microsoft Edge’s usage on Windows 11 machines increased by 23%, influenced by Microsoft setting it as the default in new builds.
- Samsung Internet’s presence on Samsung smartphones is responsible for 12.6% of Android browser traffic.
- Users are four times more likely to continue using a default browser if the switch-to setting is buried under multiple steps.
- A UK digital habits study found that 47% of users didn’t know they could change their browser defaults.
- Brave introduced a “Make Me Default” onboarding prompt, resulting in a 21% conversion rate.
- Pre-installed browsers are responsible for over 3.2 billion monthly sessions, according to a 2025 Comscore estimate.
- The EU’s Digital Markets Act prompted a 13% increase in non-default browser installations in Europe in Q1 2025.
Web Browser Trends in Enterprise vs. Consumer Use
- Microsoft Edge dominates the enterprise segment, used by 61% of corporate IT departments due to Active Directory and M365 integration.
- Chrome is still preferred in small-to-medium enterprises, with 49% usage in BYOD environments.
- Safari sees minimal enterprise adoption (under 7%), due to limited enterprise management features.
- A 2025 Gartner report found Edge loads enterprise SaaS apps 18% faster than Chrome in optimized environments.
- Firefox ESR (Extended Support Release) remains the go-to browser in 14% of education and public sector institutions.
- Enterprise-level phishing defense was rated highest in Edge, with 95% real-time threat detection.
- Remote workforce policies led to a 38% increase in VPN-based browser traffic over the past year.
- Consumer browsing trends lean heavily on personalization, with 74% favoring browsers offering AI-enhanced search.
- In finance and healthcare, IT departments restrict browser usage to two or fewer options for compliance reasons.
- Browser containerization in enterprise IT increased 22% year-over-year, especially in hybrid work setups.
Web Browser Market Size Growth (2018–2025)
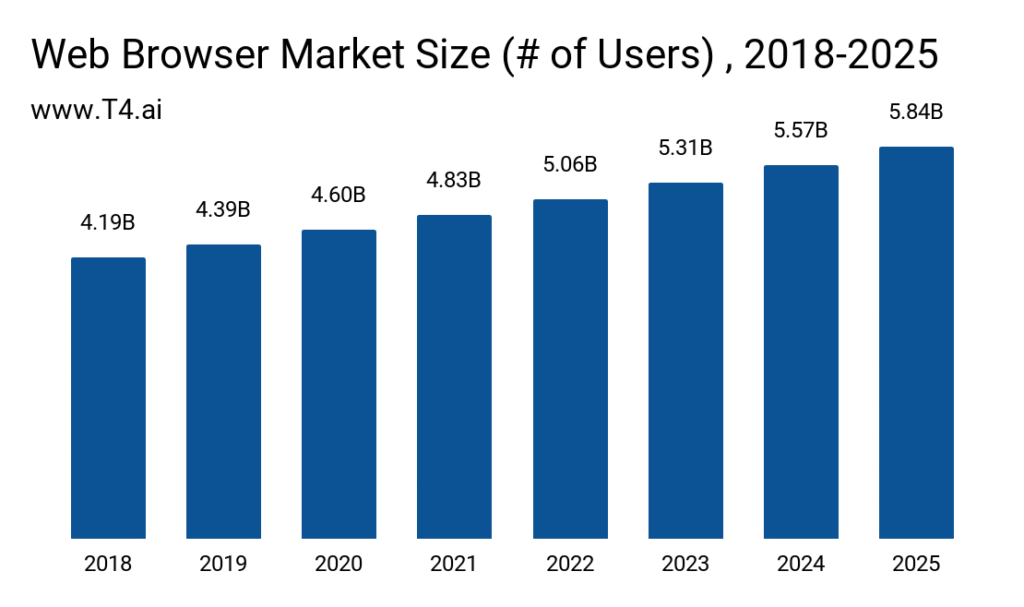
- The global web browser user base grew from 4.19 billion in 2018 to a projected 5.84 billion in 2025.
- From 2018 to 2021, the market steadily increased from 4.19B to 4.83B, showing consistent yearly growth.
- In 2022, the number of users crossed the 5 billion mark for the first time, reaching 5.06 billion.
- The growth continued with 5.31 billion users in 2023, followed by 5.57 billion in 2024.
- By 2025, the market is expected to reach 5.84 billion users, reflecting strong global digital adoption.
Recent Developments in Web Browser Technology
- Google Chrome introduced AI-assisted tab grouping and context-aware bookmarks, reducing tab clutter by 29%.
- Safari 18 launched with machine-learning-based ad filtering, boosting page load speeds by 15%.
- Microsoft Edge now supports Copilot AI integration, offering in-browser summaries and draft writing support.
- Firefox rolled out a Total Cookie Protection update in 2025, isolating cookies to prevent cross-site tracking.
- Brave launched Leo, a built-in AI assistant, generating summaries and translations in-browser without server calls.
- Opera introduced native crypto wallet integration in its desktop version, aimed at Web3-savvy users.
- Vivaldi added command-chain macros, allowing users to automate complex multi-tab workflows.
- Samsung Internet improved S Pen integration, allowing annotations directly on web pages.
- Arc Browser built a spatial tab layout, letting users arrange tabs in a visual workspace, drawing comparisons to Notion-style UX.
- Edge Workspaces are now being used by over 1 million enterprise users, enabling collaborative browsing.
Conclusion
The web browser landscape in 2025 is more fragmented, competitive, and user-driven than ever. While Chrome still holds the top spot, its dominance is slowly waning under the weight of user privacy demands, platform-native browsers, and AI-powered challengers. Safari continues to benefit from Apple’s strong ecosystem, while Edge leverages corporate environments to expand its reach.
However, the real action is unfolding in smaller, faster-growing browsers like Brave, Arc, and Vivaldi, which are redefining how users experience the web, whether it’s through privacy-first frameworks, design innovation, or AI-based utility. As digital behavior evolves, so too will our expectations from browsers, from tab managers and AI copilots to identity control and real-time protection. The browser wars of 2025 aren’t just about speed or simplicity anymore, they’re about trust, choice, and user empowerment.


