It started as a lightweight alternative to Excel, tucked quietly inside the broader Google ecosystem. But fast-forward to 2025, and Google Sheets isn’t just a spreadsheet tool; it’s a platform reshaping how individuals and businesses collaborate with data. Whether you’re a startup founder tracking KPIs, a school administrator running reports, or a marketer building dashboards on the fly, Sheets now powers more than just numbers; it empowers decisions.
This article unpacks the current landscape of Google Sheets through hard numbers and meaningful trends. From global usage to market share, enterprise adoption, and beyond, these statistics provide a snapshot of how this cloud-based spreadsheet tool continues to expand its reach in 2025.
Editor’s Choice
- 70% of all Google Workspace users actively use Google Sheets at least once per week.
- 42 million users worldwide rely on Google Sheets for collaborative tasks daily.
- In 2025, Google Sheets saw a 9.3% year-over-year increase in enterprise adoption.
- 54% of U.S. small businesses prefer Google Sheets over Microsoft Excel for data management.
- 87% of Google Sheets users utilize real-time collaboration features at least weekly.
- The average Sheets document in 2025 contains 1,300 rows.
- Google Sheets usage in education grew by 15% year-over-year, driven by K–12 digital integration.
Active Usage by Google Apps
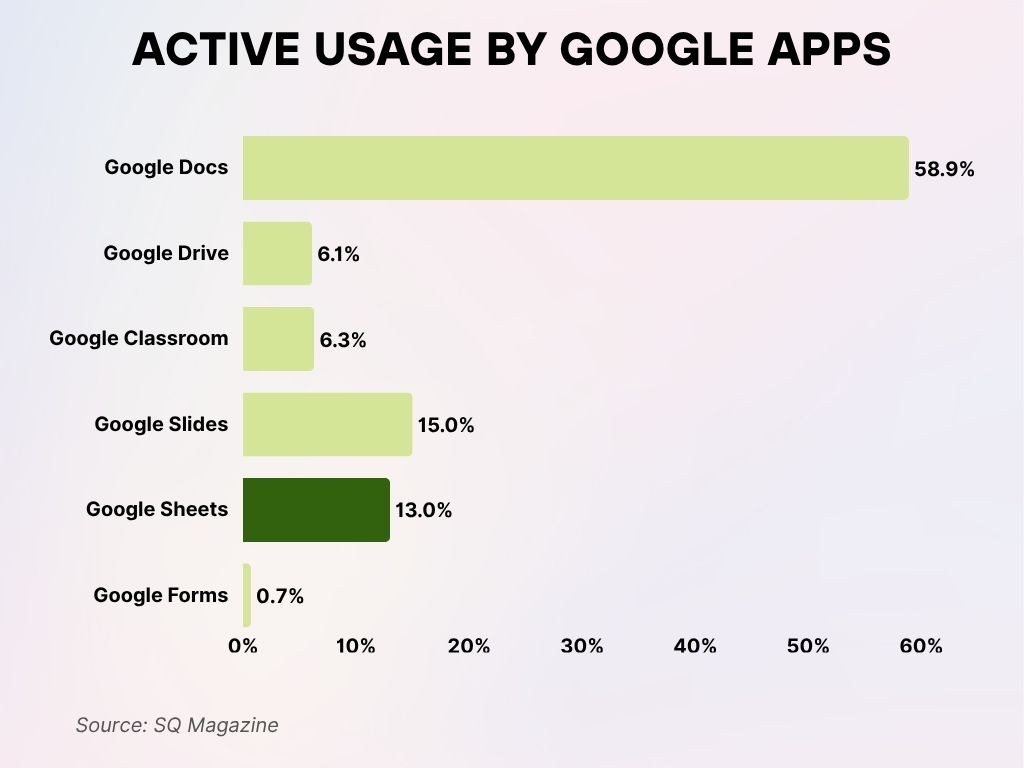
- Google Docs dominates usage with 58.9%, showing it’s the most relied-on tool among all Google Workspace apps.
- Google Slides follows at 15%, highlighting its strong use for presentations and visual learning.
- Google Sheets ranks third with 13%, indicating frequent use for data entry and calculations.
- Google Classroom usage sits at 6.3%, suggesting its importance for assignments and class organization.
- Google Drive accounts for 6.1%, showing it’s actively used for file storage and sharing.
- Google Forms has the least usage at 0.7%, pointing to limited activity in form creation or surveys.
Global Usage of Google Sheets
- As of 2025, there are over 1.1 billion active Google Sheets files stored globally.
- Google Sheets is now used in 92 countries across education, business, government, and nonprofit sectors.
- 31% of users access Google Sheets from mobile devices globally.
- Google Workspace, which includes Sheets, saw a 6.8% growth in user base, now reaching 360 million worldwide.
- Sheets adoption is highest in North America (38%), followed by Europe (28%) and Asia-Pacific (21%).
- Latin America has seen a 12.4% growth in Sheets usage since 2024.
- In India, Google Sheets usage has doubled among freelance professionals and remote teams.
- Over 14 million Sheets-based dashboards are created each month by analytics professionals.
- 18% of Google Sheets global users are in the financial services sector.
- Google Sheets templates for budgeting and project planning remain among the top 10 most downloaded Workspace assets.
Adoption Trends Among Businesses and Enterprises
- In 2025, Google Sheets is used by 63% of businesses with fewer than 500 employees.
- Enterprise adoption of Sheets rose to 42%.
- Healthcare and biotech companies report a 29% increase in Google Sheets-based data tracking solutions.
- Retail organizations using Sheets for inventory tracking grew by 17% year-over-year.
- 75% of remote-first companies have standardized Google Sheets for internal data handling.
- In the financial services industry, Sheets adoption among mid-sized firms grew by 11.5%.
- Sheets integration into CRM platforms like Salesforce rose by 21% in 2025.
- Over 190,000 businesses use custom Google Sheets dashboards for operations.
- Sheets usage in procurement and logistics departments saw a 16% annual rise.
- Businesses using Google Sheets APIs for workflow automation increased by 24% year-over-year.
- Onboarding templates built in Sheets are now used by 3 in 5 HR departments at U.S. tech firms.
Office Productivity Software Market Share
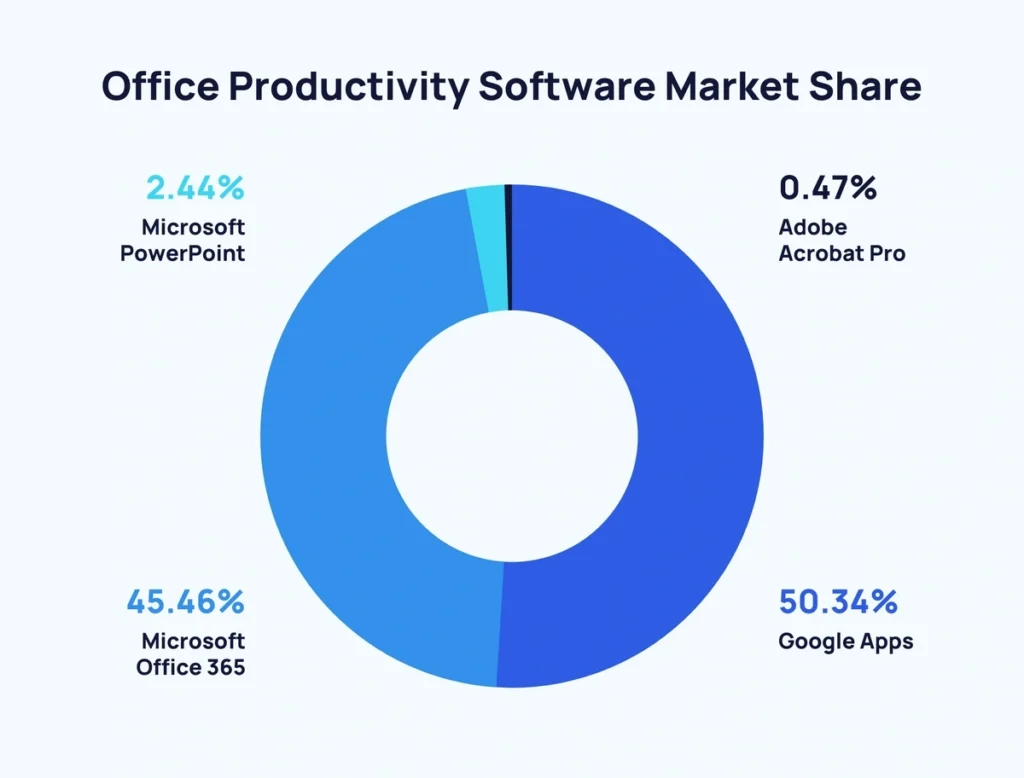
- Google Apps leads the market with a dominant 50.34% share, reflecting its popularity across both educational and professional sectors.
- Microsoft Office 365 holds 45.46%, showing continued strong adoption in corporate environments.
- Microsoft PowerPoint captures 2.44%, indicating niche but consistent usage for presentations.
- Adobe Acrobat Pro accounts for only 0.47%, suggesting a limited market presence among productivity tools.
User Demographics and Industry Usage
- In 2025, Google Sheets is most used by professionals aged 25–34, accounting for 38% of total users.
- 61% of Google Sheets users identify as intermediate or advanced spreadsheet users.
- Technology and IT sectors represent the largest industry demographic using Sheets, comprising 27% of total usage.
- Education follows closely, with 22% of Sheets users coming from K–12 schools and universities.
- Among freelancers, 68% use Sheets as their primary data tool.
- Nonprofits report a 43% usage rate of Google Sheets for donation tracking and grant reporting.
- 35% of marketing professionals** now prefer Sheets over Excel due to ease of collaboration.
- In the real estate industry, Sheets adoption grew by 19% year-over-year.
- Finance and accounting professionals use Sheets for real-time dashboards in 31% of their reporting processes.
- Remote workers use Sheets more heavily than office-based teams, logging 22% more weekly activity on average.
Integration with Google Workspace and Third-Party Apps
- As of 2025, over 65% of Sheets users leverage Google Workspace integrations like Docs, Slides, and Forms.
- Google Sheets and Gmail are the most integrated pair, used together in 74% of business workflows.
- Calendar and Google Sheets syncing for schedule and budget planning grew by 28% in usage.
- Over 120 third-party apps now offer direct integration with Sheets, including Asana, Zapier, and HubSpot.
- Sheets + Google Forms integration is used in 60% of employee survey reports across enterprises.
- CRM syncing with Sheets (like Salesforce, Zoho CRM) increased by 23% year-over-year.
- Looker Studio connects with Google Sheets in 39% of its dashboards globally.
- Sheets and Google Apps Script power 18% of internal tool automation within medium-sized companies.
- ClickUp and Trello users export to Sheets in over 50% of project analytics workflows.
- Google Sheets API calls surpassed 900 million per month globally in 2025.
Google Sheets vs. Microsoft Excel: Feature Comparison
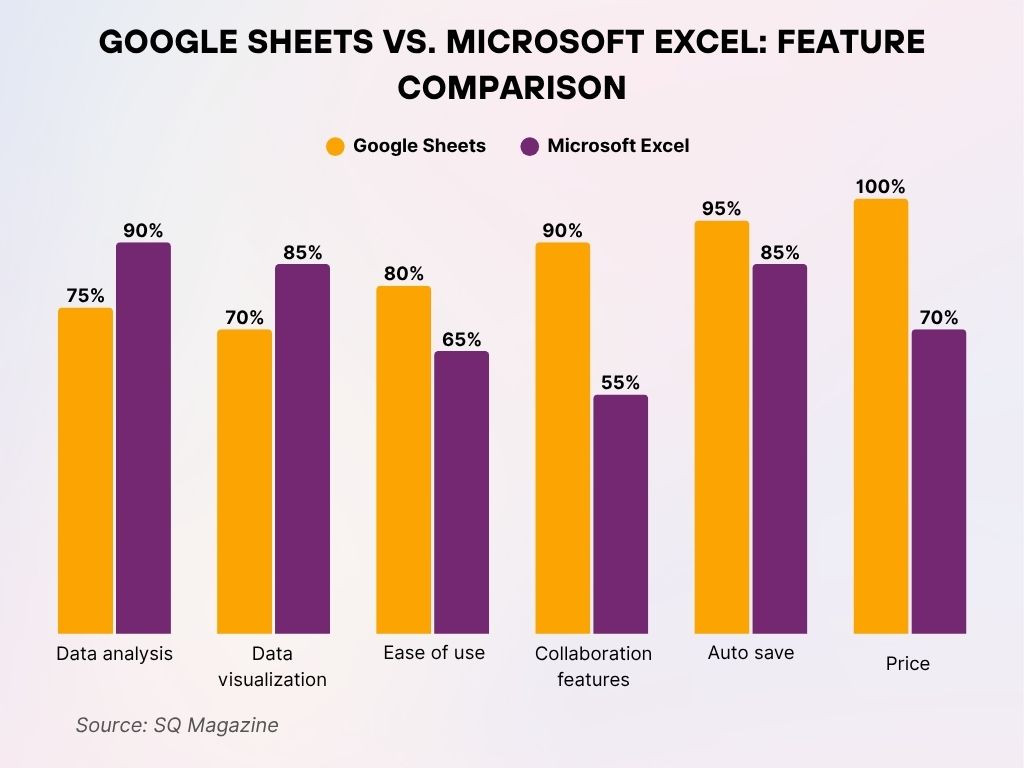
- Microsoft Excel leads in data analysis with 90%, outperforming Google Sheets at 75%.
- Excel also excels in data visualization, scoring 85%, compared to Google Sheets’ 70%.
- Google Sheets wins in ease of use with 80%, while Excel trails at 65%.
- For collaboration features, Google Sheets dominates with 90%, far ahead of Excel’s 55%.
- Auto save is better in Google Sheets at 95%, compared to Excel’s 85%.
- On price, Google Sheets is unbeatable with 100%, while Excel scores 70%.
Mobile vs Desktop Usage Patterns
- In 2025, 72% of Google Sheets usage still occurs on desktop, with 28% on mobile platforms.
- Mobile usage has increased by 6%, driven by better Sheets app optimization.
- The Android Sheets app accounts for 19% of mobile sessions, compared to 9% on iOS.
- Users spend 2.4x more time on Google Sheets when using a desktop versus a mobile.
- Tablet usage accounts for just 3.5% of all Google Sheets activity, despite high engagement in the education sector.
- Offline editing on mobile grew by 21%, largely due to travel and field work needs.
- Voice input and smart fill features are used in 13% of mobile Sheets sessions.
- Sheet sharing via mobile (directly through messaging or email) grew by 31% in 2025.
- The most frequent mobile usage activities are task lists, expense logs, and form responses review.
- Desktop remains dominant for large datasets and formula-heavy models, accounting for 84% of such files.
Top Use Cases and Functionalities Leveraged
- Budgeting and financial tracking is the most common use case, used by 68% of all Sheets users.
- Collaborative planning (e.g., marketing calendars, OKRs) is the second-most popular use, at 54%.
- Pivot tables are used in 26% of business-created spreadsheets.
- Conditional formatting is applied in 47% of files containing over 100 rows.
- Data validation rules are used by 38% of Sheets power users in enterprise settings.
- Custom formulas and array functions are present in 1 in 3 Sheets with over 10 collaborators.
- Real-time comments and tagging features are active in 40% of workgroup files.
- Query functions and filter views usage increased by 22% over the past year.
- Embedded charts appear in 29% of spreadsheets created within marketing departments.
- Task management templates downloaded from Google’s template gallery are up by 35% in 2025.
Top Industries That Use Google Drive
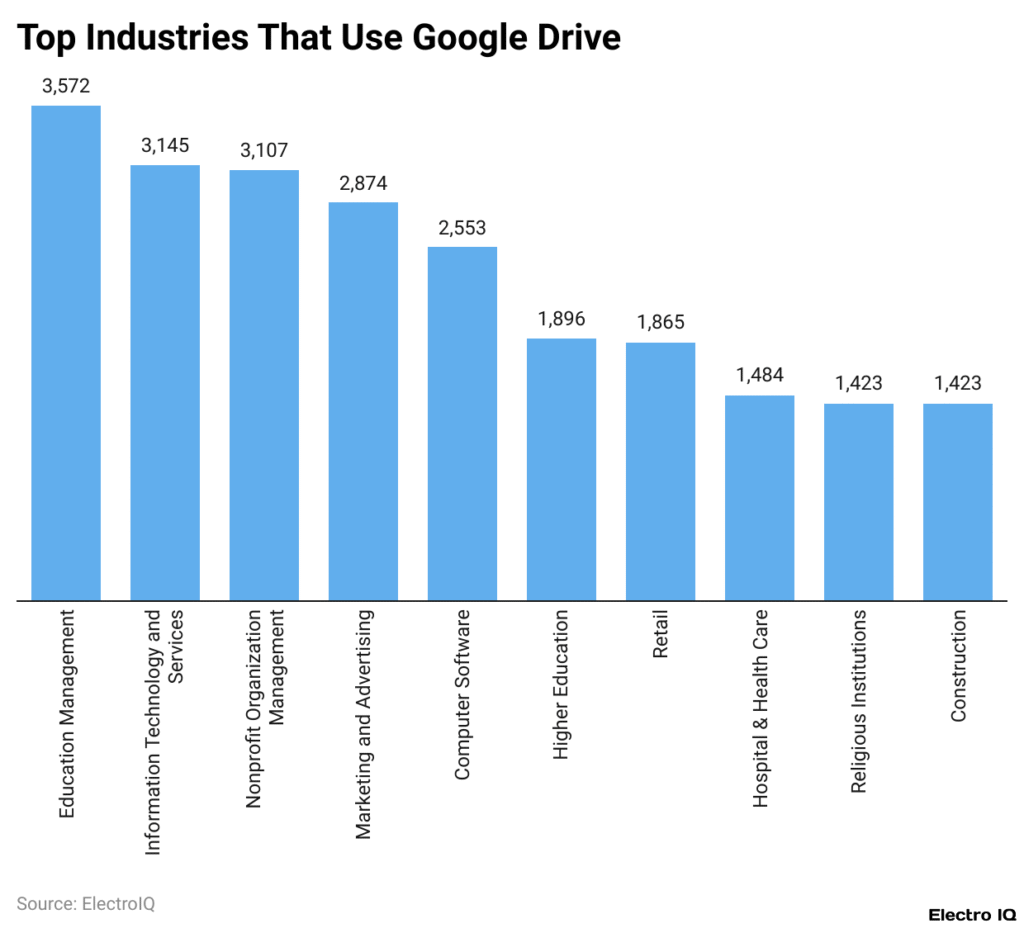
- Education Management leads all industries with 3,572 active users of Google Drive.
- Information Technology and Services ranks second with 3,145 users.
- Nonprofit Organization Management follows closely with 3,107 users.
- Marketing and Advertising sees significant adoption with 2,874 users.
- Computer Software shows widespread usage with 2,553 users.
- Higher Education contributes 1,896 users to the platform.
- Retail uses Google Drive with 1,865 users, showing traction in commercial sectors.
- Hospital & Health Care accounts for 1,484 users.
- Both Religious Institutions and Construction tie with 1,423 users each, reflecting utility even in niche sectors.
Education Sector Utilization of Google Sheets
- Over 55% of U.S. public schools** actively use Google Sheets as part of Google Workspace for Education.
- Google Sheets is part of the core curriculum tools in 43% of school districts using Chromebooks.
- 87% of student surveys** in classrooms are now conducted using Forms + Sheets.
- Instructors report using Sheets for gradebooks in 66% of middle and high schools.
- Special education programs use Sheets to manage IEP documentation in 1 in 4 U.S. schools.
- University research teams use Google Sheets for collaborative data collection in over 70% of group studies.
- Sheets training modules are part of onboarding in more than 800 colleges globally.
- Integration with Google Classroom boosted Sheets assignments by 21% year-over-year.
- Data visualization projects using Sheets in high schools grew by 34% in 2025.
Pilot Evaluation of Using Google Sheets in the Classroom
- In pilot studies across 300+ U.S. schools, 82% of educators rated Google Sheets as “very effective” for student engagement.
- Students using Sheets for group projects showed a 19% improvement in collaboration scores.
- In classrooms integrating Sheets with Forms and Slides, assignment completion rates rose by 22%.
- Teachers reported saving 3.4 hours per week using Sheets for grading and attendance.
- Sheets + Google Apps Script was used in 12% of classrooms for automating weekly performance reports.
- High school math teachers used Sheets for teaching functions and equations in 61% of test schools.
- 80% of students in pilot programs felt more confident using spreadsheets for STEM tasks.
- Real-time progress dashboards created in Sheets improved student visibility into their own performance by 47%.
- Parent-teacher communication using automated Sheets reports increased by 2x compared to traditional channels.
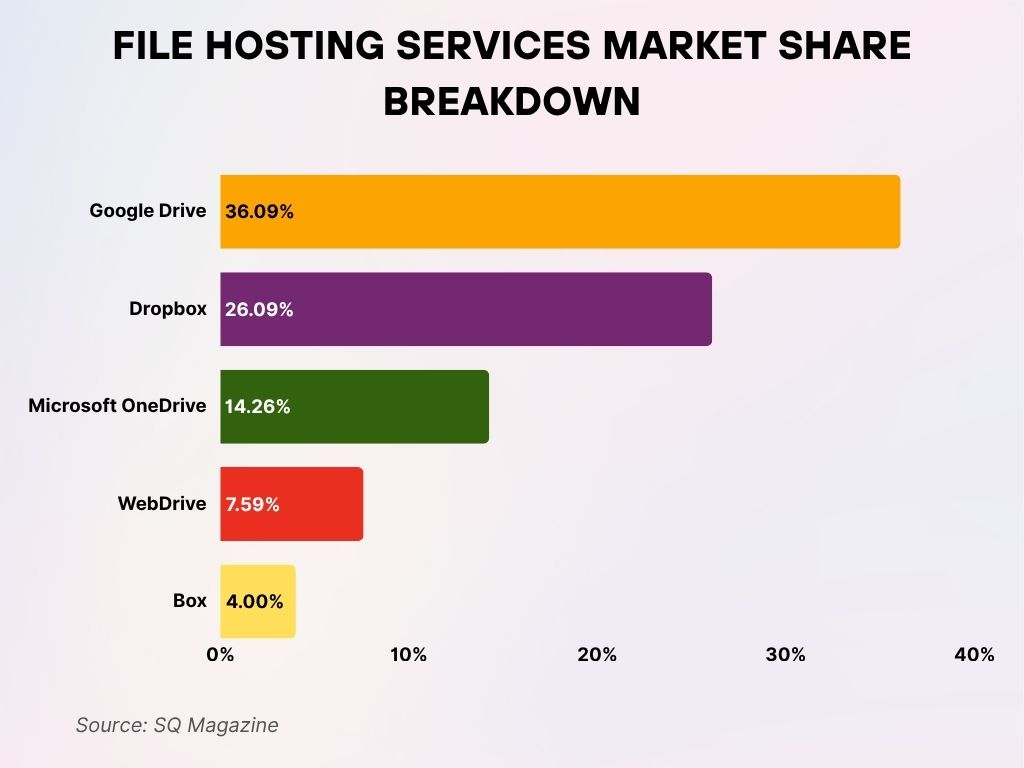
File Hosting Services Market Share Breakdown
- Google Drive leads the market with a 36.09% share, making it the top choice for cloud file storage.
- Dropbox comes in second with 26.09%, showing strong continued usage across business and personal users.
- Microsoft OneDrive holds a 14.26% market share, reflecting steady integration within Windows and Office ecosystems.
- WebDrive captures 7.59%, indicating niche usage among specific enterprise environments.
- Box holds the smallest share at 4%, showing limited but focused adoption, especially in corporate collaboration.
Google Sheets Add-ons for Reporting and Analysis
- As of 2025, there are over 520 certified Google Sheets add-ons available in the Workspace Marketplace.
- The most downloaded add-ons for reporting include Supermetrics, Power Tools, and Coupler.io.
- 61% of Sheets users in marketing and eCommerce use at least one analytics add-on weekly.
- Automated reporting tools in Sheets saw a 29% year-over-year increase in active usage.
- Finance and accounting teams account for 33% of advanced analytics add-on installations.
- Google Analytics add-on remains the most used reporting extension, with 4.3 million active users.
- Data export add-ons from platforms like Shopify, HubSpot, and Stripe are used by 27% of online retailers.
- HR departments using add-ons for payroll and leave tracking jumped by 18% this year.
- Pivot Table Helper add-on usage is up 21%, especially in academic and survey research.
- Add-ons optimized for real-time refresh and scheduled reports increased their user base by 36% in 2025.
Using Statistical Add-ons for Advanced Analysis
- Solver, XLMiner, and BigML are among the top statistical analysis tools integrated into Sheets.
- In 2025, 28% of power users** reported using add-ons for regression analysis and forecasting.
- Time series modeling via add-ons like Forecast Forge grew by 17% in the past year.
- Machine learning integrations with Google Sheets rose by 31%, especially in data science education.
- Logistic regression models are used in 12% of spreadsheets within the healthcare and insurance sectors.
- Data anonymization tools embedded in Sheets increased in adoption by 23% for GDPR compliance.
- Sheets users in market research firms rely on statistical add-ons in 4 out of 10 projects.
- A/B testing data is now managed via Sheets in 26% of mid-market SaaS businesses.
- Anomaly detection add-ons are being used in 19% of manufacturing and quality assurance teams.
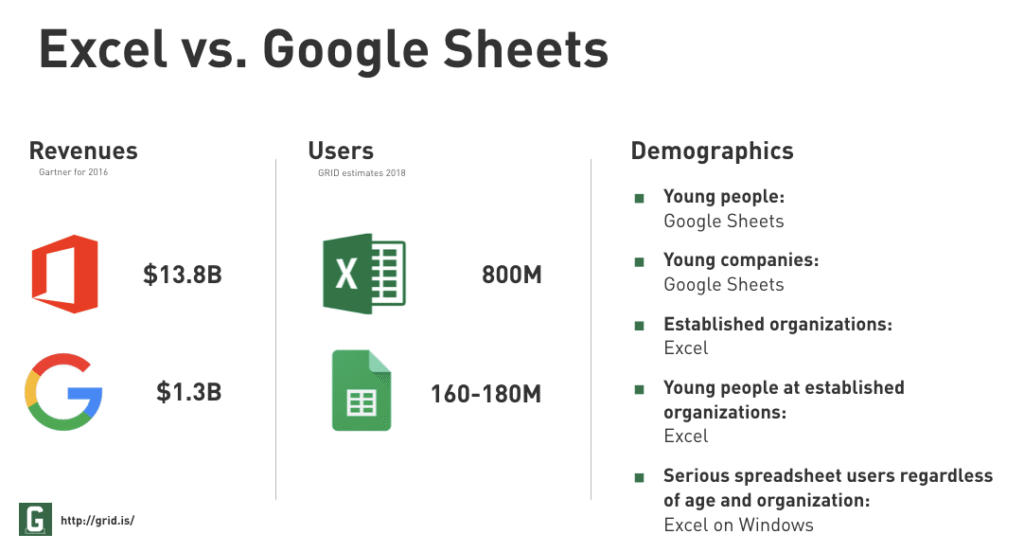
Excel vs. Google Sheets: Revenue, Users, and Demographics
- Microsoft Excel generated $13.8B in revenue, massively ahead of Google Sheets at $1.3B.
- Excel also dominates in user count with 800M users, compared to Google Sheets’ estimated 160–180M.
- Google Sheets is more popular among young people and young companies, due to its accessibility and collaboration features.
- Excel is preferred by established organizations and young professionals within traditional enterprises.
- Serious spreadsheet users, regardless of age or industry, favor Excel on Windows for its advanced capabilities.
Create Reports & Dashboards in Seconds with AI
- Smart Canvas features in Google Sheets allow users to auto-generate dashboards with 92% accuracy in test environments.
- In 2025, Sheets users created over 27 million AI-assisted dashboards using Smart Chips and AI insights.
- Natural language queries in Sheets (e.g., “show sales by region”) grew by 38% in enterprise settings.
- AI-driven pivot tables are now built in under 7 seconds for datasets under 10,000 rows.
- Charts and graphs auto-suggested by AI match user intent in 84% of tested scenarios.
- Google Duet AI, introduced to Sheets in late 2024, saw adoption in 44% of U.S. business teams.
- AI-powered formatting tools (e.g., alternate row shading, conditional rules) are now used in 21% of new templates.
- AI-generated trend summaries are used in 31% of performance dashboards by sales departments.
- Recruitment teams use AI insights to build candidate comparison dashboards from Sheets data, up 33% YoY.
Quick Way to do Data Analysis with Google Sheets
- The Explore feature in Sheets is used by 57% of users to identify quick data patterns and visuals.
- Quick functions like SUM, COUNTIF, and AVERAGE are auto-suggested correctly in 90% of Sheets edits.
- Smart fill and smart suggestions saved users an average of 2.6 hours per week on repetitive tasks.
- Filter views and slicer tools are utilized in 39% of dashboards built in 2025.
- QUERY and IMPORT functions usage rose by 26%, especially among advanced users.
- Data analysts report Sheets being the “fastest-to-learn” tool for junior analysts, with a 60% onboarding success rate within the first month.
- Pre-built templates for cohort analysis, funnel metrics, and financial modeling grew in downloads by 42%.
- Real-time Google Sheets integrations with platforms like BigQuery enable quick querying of datasets up to 1 million rows.
- Conditional charting logic is now used by 18% of Sheets-based project dashboards.
Recent Developments and Feature Updates in Google Sheets
- In March 2025, Google Sheets rolled out Smart Fill 2.0, increasing prediction accuracy by 31%.
- Duet AI integration allows users to get formula explanations, write functions, and automate steps in natural language.
- Checkbox enhancements now support conditional logic and linked formatting, adopted by 17% of users in project tracking.
- Google Sheets timeline view now allows color-coded grouping and collapsible task rows, used by 24% of product managers.
- Collapsible group rows and sections, introduced in Q1 2025, are used in 38% of new templates.
- Data classification tags help users label Sheets as “Confidential,” “Internal,” or “Public”, already used by 11% of enterprise accounts.
- Protected ranges with expiration dates are now available, helping HR teams limit editing during onboarding processes.
- Enhanced app scripting environment now includes a built-in debugger and log viewer, adopted by 21% of dev teams.
- Sheets now offers 20% faster loading speeds for files over 200,000 rows.
- Offline sync stability improved by 43%, reducing errors in low-bandwidth scenarios.
Conclusion
From classrooms and startups to corporations and field teams, Google Sheets in 2025 has evolved far beyond its humble beginnings. With stronger AI support, widespread integrations, and rising adoption across industries, it’s no longer just a spreadsheet tool; it’s a central nervous system for modern work.
This year’s statistics show how Sheets is meeting the demands of speed, flexibility, and collaborative intelligence. Whether it’s through advanced statistical modeling, seamless reporting, or smart automations, Google Sheets remains the tool of choice for teams that move fast and think clearly.


