WHAT WE HAVE ON THIS PAGE
- Editor’s Choice
- iPhone vs Android Smartphone Sales in Select Countries
- iPhone vs Android User Loyalty
- The App Store vs Google Play Store
- iPhone vs Android Usage by Age Group
- App Ecosystem: iPhone vs Android
- iPhone vs Android App Revenue
- iPhone vs Android App Spending (2021–2026)
- User Experience: iOS vs Android
- Revenue and Profit Comparison
- Mobile Operating System Market Share (Worldwide)
- Security and Privacy Statistics
- Device Longevity and Upgrade Cycles
- Number of iPhone Users Worldwide (2016–2025)
- Regional Popularity and Market Trends
- Trends in iPhone and Android Adoption Rates (Recent Developments)
- Customer Loyalty: iPhone vs Android
- Conclusion
- Sources
Imagine standing in a crowded coffee shop, phone in hand. Look around—you’ll see a divided world: some clutch sleek iPhones, others tap away on Android devices. In 2025, the great “iPhone vs Android” debate is stronger than ever. Both ecosystems boast loyal fan bases, innovative features, and impressive market statistics. Whether you’re an Apple aficionado or an Android enthusiast, understanding the real numbers behind these two giants gives you a clearer view of today’s smartphone landscape.
Editor’s Choice
- Apple’s iPhone market share globally hit 29.1% in early 2025.
- Android continues to dominate with a 70% global smartphone market share as of Q1 2025, according to Statista.
- In the United States, iPhone users make up 58% of smartphone ownership.
- Android holds a commanding lead in Asia-Pacific, representing 81% of smartphone sales as of April 2025.
- iOS user loyalty reached an all-time high of 94% compared to Android’s 89%, according to a CIRP survey.
- The App Store generated approximately $44 billion in revenue in the first half of 2025, significantly outperforming the Google Play Store, which reported $28 billion.
- iPhone users spend an average of $140 annually on apps, compared to $69 for Android users.
iPhone vs Android Smartphone Sales in Select Countries
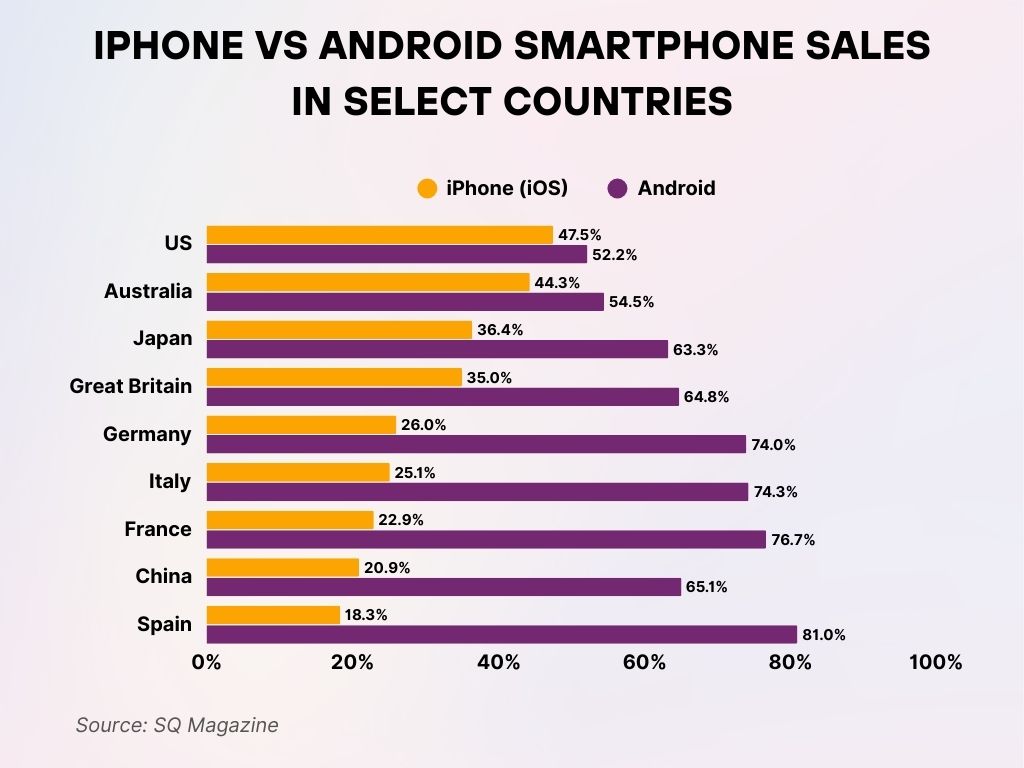
- United States: iPhone has 47.5% market share, while Android leads slightly at 52.2%.
- Australia: Android captures 54.5% of the market, beating iPhone at 44.3%.
- Japan: Android dominates with 63.3% market share, while iPhone holds 36.4%.
- Great Britain: Android controls 64.8% of the market, compared to iPhone’s 35%.
- Germany: Android leads with a strong 74%, while iPhone trails at 26%.
- Italy: Android secures 74.3% market share, outpacing iPhone’s 25.1%.
- France: Android holds 76.7%, significantly ahead of iPhone’s 22.9%.
- China: Android commands 65.1%, while iPhone holds 20.9% of the market.
- Spain: Android dominates with 81%, leaving iPhone with only 18.3%.
iPhone vs Android User Loyalty
- In a 2025 survey, 94% of iPhone users said they plan to stick with Apple for their next device.
- Android users have an impressive loyalty rate as well, with 89% intending to stay within the ecosystem.
- Brand-switching among Android users tends to occur primarily toward Samsung, with 57% favoring a switch within Android brands.
- Only 8% of iPhone users considered switching to Android in 2025.
- Among those who switched to iPhone from Android, 68% cited “better ecosystem” as the main reason.
- Cost concerns led 45% of Android switchers to move from iPhone to Android.
- iOS satisfaction ratings are at 92%, compared to 84% for Android users globally.
- Google Pixel users are among the most loyal Android users, with a retention rate of 83%.
- Loyalty is highest among younger demographics: 96% of Gen Z iPhone users are loyal to Apple.
- Software updates contribute heavily, with 78% of users citing timely updates as a major loyalty driver for iPhone.
The App Store vs Google Play Store
- As of Q1 2025, the Apple App Store has 1.96 million apps available, while the Google Play Store leads with 3.48 million apps.
- Despite fewer apps, App Store users spent 1.5x more per download compared to Google Play users.
- Revenue from the App Store in H1 2025 hit approximately $44 billion, compared to $28 billion from the Play Store.
- The App Store hosts more paid apps—approximately 14% of its library, compared to 7% on Google Play.
- Educational apps perform better on the App Store, generating 60% more downloads compared to Android.
- App Store review times have improved significantly in 2025, averaging 24 hours, compared to Google Play’s 36 hours.
- Security concerns have reduced among users, with 82% trusting App Store apps, compared to 65% trusting Play Store apps.
- Subscription-based apps earn 87% more revenue on iOS compared to Android.
- In emerging markets, Google Play downloads have grown by 12% year-over-year, primarily driven by India and Southeast Asia.
- Gaming apps remain dominant, making up 40% of revenue on the App Store and 37% on the Google Play Store.
iPhone vs Android Usage by Age Group
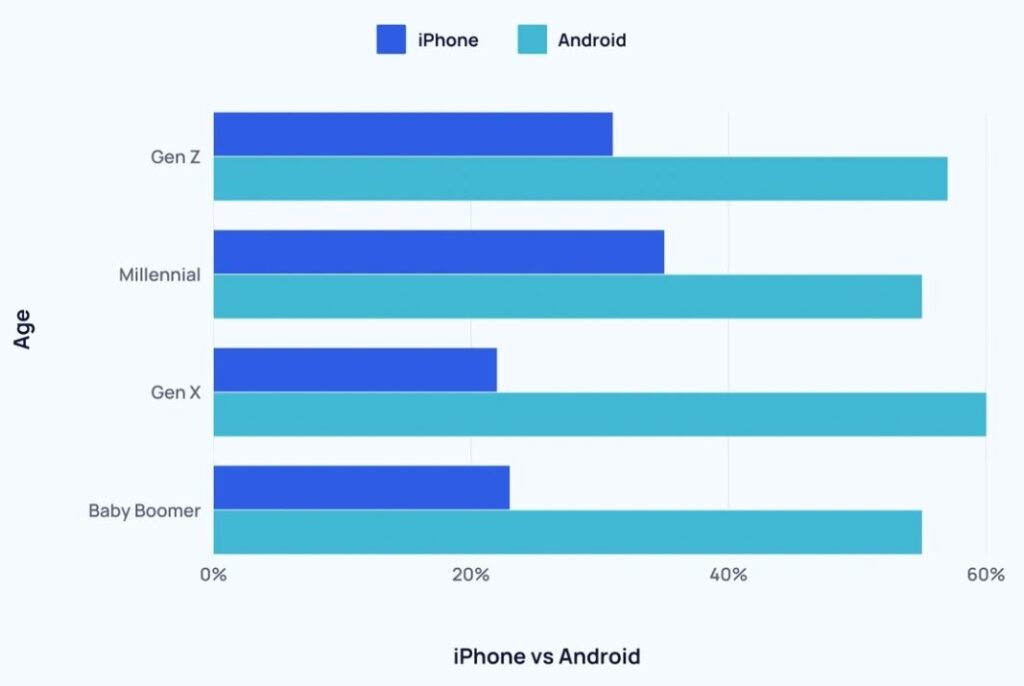
- Gen Z: iPhone users make up about 40%, while Android users dominate at nearly 60%.
- Millennials: iPhone accounts for roughly 35%, with Android leading at about 55%.
- Gen X: iPhone usage drops to around 25%, and Android usage rises to nearly 60%.
- Baby Boomers: iPhone captures only about 20%, while Android strongly leads with over 55%.
App Ecosystem: iPhone vs Android
- iPhone users install an average of 40 apps on their devices, compared to Android users, who average 35 apps.
- Productivity apps are installed by 27% more iPhone users than Android users.
- Social media apps are equally popular, with 95% penetration across both platforms.
- iOS users are more likely to pay for premium apps—22% versus 12% of Android users.
- The average session time per app is longer for Android users, at 7.5 minutes, compared to 6.2 minutes on iOS.
- Android supports a broader range of niche apps for customization, such as launchers, used by 18% of Android users.
- Augmented reality (AR) apps see 30% higher engagement on iOS, fueled by Apple’s ARKit investments.
- Cross-platform app development (using tools like Flutter) now accounts for 48% of all new app builds.
- iOS apps tend to receive updates faster, with an average update cycle of 18 days, compared to 25 days for Android apps.
- Wearable app integrations are more common among iPhone users, particularly with Apple Watch compatibility.
iPhone vs Android App Revenue
- In 2025, the App Store generated nearly 60% of all mobile app revenue globally.
- Google Play Store accounts for about 38% of total mobile app revenue in 2025.
- The top 100 apps on the App Store earned an average of $13 million each in Q1 2025, while on Google Play, it was $7.8 million.
- In-app purchases made by iPhone users were 2x higher than those made by Android users.
- Subscription services represent 53% of the App Store’s total revenue, versus 41% for Google Play.
- Gaming apps remain the highest earners, making up 66% of App Store revenue and 61% of Google Play revenue.
- Emerging trends show financial services apps growing faster on Android, with a 22% YoY growth rate.
- Healthcare and fitness apps generated 15% more revenue on iOS than Android as of April 2025.
- App revenue in the US market is still heavily tilted toward iPhone, accounting for 71% of total mobile app spend.
- Microtransactions (under $5) remain more common among Android users, while iPhone users are likelier to spend over $10 per purchase.
iPhone vs Android App Spending (2021–2026)
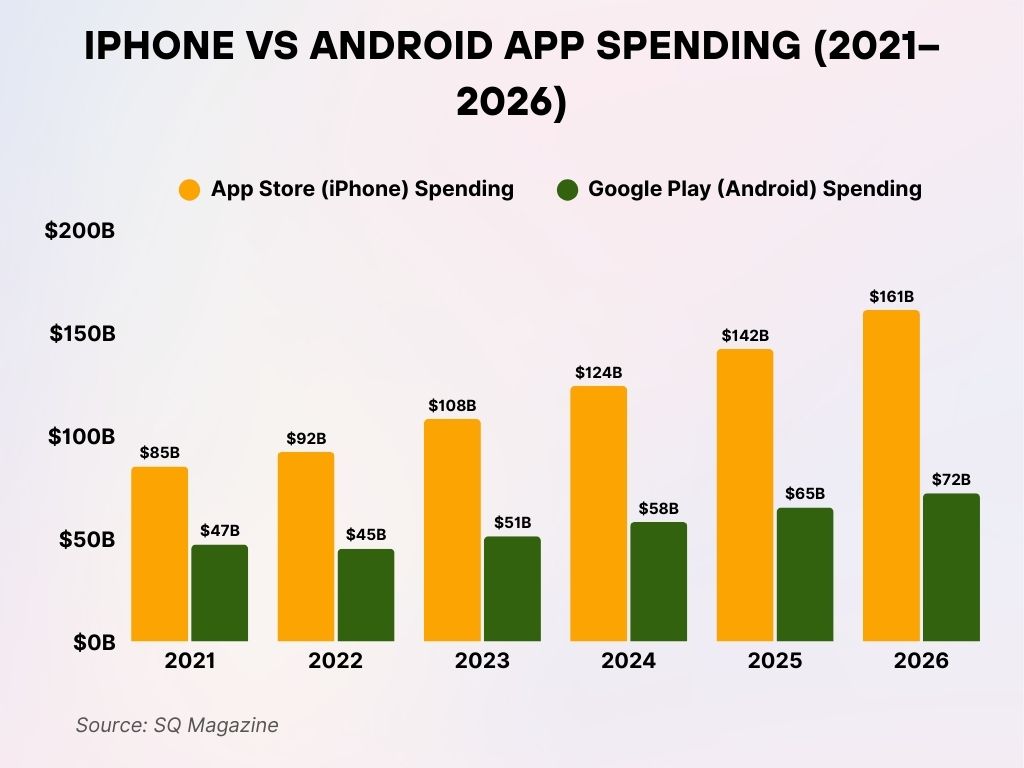
- 2021: App Store (iPhone) spending reached $85 billion, while Google Play (Android) spending totaled $47 billion.
- 2022: iPhone app spending increased to $92 billion, whereas Android app spending slightly declined to $45 billion.
- 2023: App Store spending grew to $108 billion, compared to Google Play’s $51 billion.
- 2024: iPhone app spending rose to $124 billion, while Android app spending climbed to $58 billion.
- 2025: App Store spending surged to $142 billion, with Google Play spending reaching $65 billion.
- 2026: iPhone app spending is projected to hit $161 billion, while Android app spending is expected to grow to $72 billion.
User Experience: iOS vs Android
- iOS leads in user satisfaction scores, with a 92% satisfaction rate, compared to 86% for Android.
- System updates are faster for iPhones—93% of iPhone users are on the latest iOS version within 6 months, compared to 20% for Android.
- Customization options are broader on Android; 76% of Android users customize their home screen versus 41% of iPhone users.
- Face ID adoption among iPhone users is now at 85%, offering seamless security experiences.
- Battery performance is cited as better by 67% of Android users, especially on devices with large battery capacities like Samsung’s Galaxy series.
- iPhone displays lead in color accuracy, scoring 98% on display benchmarks compared to 92% for top Android screens.
- Voice assistants: Siri adoption among iPhone users remains strong at 79%, while Google Assistant usage among Android users is at 82%.
- Multi-device integration is better with Apple’s ecosystem: 72% of iPhone users also own at least one other Apple device (MacBook, Apple Watch, iPad).
- Software longevity favors iOS; iPhones receive updates for 5–6 years, compared to an average of 2–3 years for Android.
- Gaming experience on flagship iPhones (like iPhone 15 Pro) scores 15% higher in frame rate stability compared to premium Android phones.
Revenue and Profit Comparison
- Apple’s iPhone segment generated over $220 billion in revenue, representing 55% of the total company income.
- Android smartphones collectively generated approximately $190 billion globally, across all brands combined.
- Apple’s profit margins per iPhone sold are around 38%, while Android OEMs average 10–15% profit margins.
- Samsung’s Galaxy division recorded $94 billion in revenue from smartphone sales.
- Google’s Pixel division saw a 12% year-over-year revenue increase for smartphones.
- Xiaomi’s smartphone revenue surpassed $40 billion globally.
- iPhone 15 Pro Max alone has contributed over $30 billion to Apple’s revenue since its launch.
- The average Selling Price (ASP) of an iPhone was $969 in 2025, compared to $312 for Android smartphones.
- Luxury Android phones, such as Samsung’s Galaxy Z Fold5, have ASPs close to $1,800, but occupy less than 0.5% of Android shipments.
- Despite Android’s larger unit sales volume, Apple captures nearly 85% of smartphone industry profits.
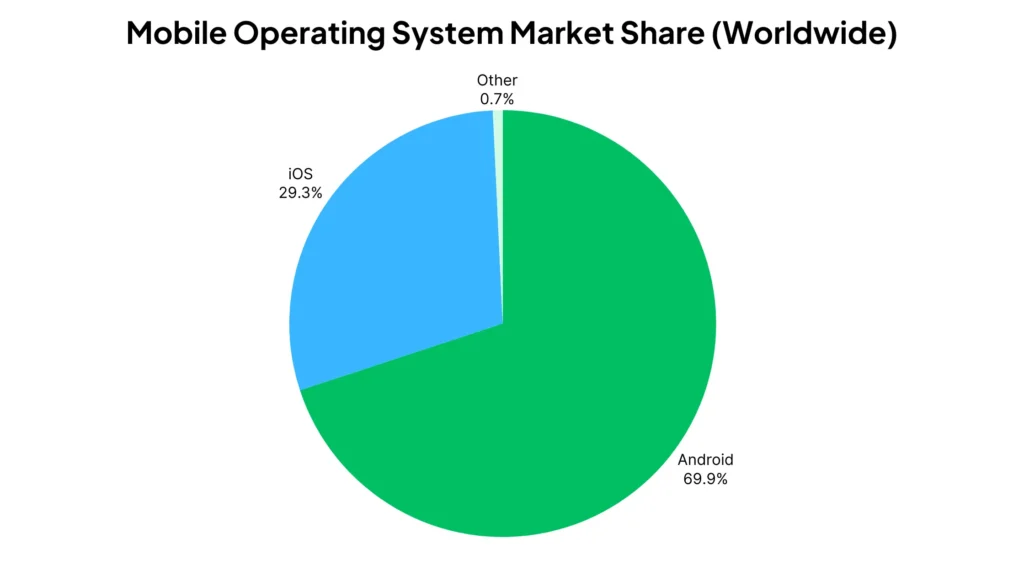
- Android dominates the global market with a massive 69.9% share.
- iOS holds a strong second place, capturing 29.3% of the market.
- Other operating systems combined account for only 0.7% of the total market share.
Security and Privacy Statistics
- In 2025, Apple maintained a 95% approval rating among users for privacy protection practices.
- Android 14 improved its security protocols, reducing malware infections by 27%.
- iOS devices accounted for only 1% of all mobile malware incidents reported globally in 2025.
- Meanwhile, Android devices made up approximately 98% of mobile malware cases, a 5% decrease from last year.
- App tracking transparency on iOS led 65% of users to opt out of app tracking, impacting digital ad revenues.
- Google Play Protect scanned 125 billion apps daily in 2025, increasing security coverage by 20%.
- iPhone users were 2.5x less likely to experience a data breach compared to Android users.
- Biometric security adoption rose to 92% among iPhone users (Touch ID and Face ID), while Android biometric usage reached 79%.
- Encrypted messaging apps, like iMessage and Signal, saw a 30% higher adoption rate among iPhone users.
- New on-device processing models in iOS ensure 85% of Siri requests never leave the user’s device, boosting privacy standards.
Device Longevity and Upgrade Cycles
- The average lifespan of an iPhone has risen to 5.5 years in 2025.
- Android devices have an average lifespan of 3.5 years, consistent over the past three years.
- 65% of iPhone users upgrade their device every 3 years or more, compared to 49% of Android users.
- iPhone trade-in programs have surged in popularity, with 40% of U.S. iPhone owners participating in 2025.
- Android upgrades are often driven by technological necessity, with 55% of users citing performance slowdown.
- iOS updates reach devices up to 6 years old, whereas most Android phones stop receiving updates after 3 years.
- Resale value for iPhones remains the highest, retaining approximately 65% of original value after 2 years, compared to Android’s 30%.
- Battery replacements are 1.5x more frequent among Android users compared to iPhone users.
- 90% of iPhone 12 models sold in 2020 are still actively in use as of early 2025.
- Sustainability ratings favor Apple, with 78% of refurbished iPhones re-entering the consumer market versus 48% for Android.
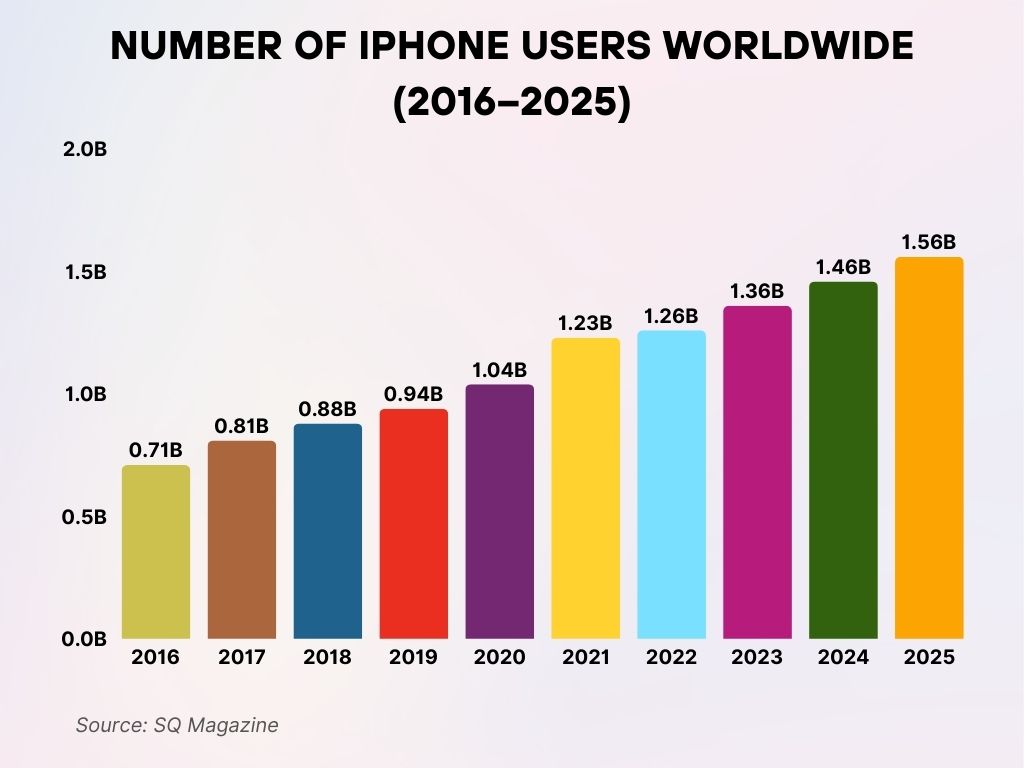
Number of iPhone Users Worldwide (2016–2025)
- In 2016, there were 0.71 billion iPhone users globally.
- By 2017, the number rose to 0.81 billion, showing continued growth.
- 2018 saw a further increase, reaching 0.88 billion users worldwide.
- In 2019, global iPhone users climbed to 0.94 billion.
- The 2020 user base crossed the 1-billion mark at 1.04 billion.
- In 2021, users surged to 1.23 billion, marking a significant jump.
- 2022 saw steady growth, with 1.26 billion iPhone users.
- In 2023, the count grew to 1.36 billion users globally.
- 2024 marked another rise, reaching 1.46 billion users.
- By 2025, the global iPhone user base is projected to hit 1.56 billion.
Regional Popularity and Market Trends
- North America remains iPhone-dominant, with iOS commanding 58% of the market share in 2025.
- Europe continues as an Android stronghold, holding 67% of smartphone market share.
- China’s Android share dipped slightly to 79% in 2025, while iPhone adoption grew to 21%.
- In India, Android dominates, making up a staggering 93% of the smartphone market.
- Japan remains an Apple-centric nation, where iPhones account for 52% of smartphone usage.
- Brazil and Mexico are key Android territories, with Android usage above 87% in both countries.
- Australia reports a nearly even split: 49% iPhone and 50% Android, showing market maturity.
- Sub-Saharan Africa continues to rely heavily on Android, occupying 95% of the market share.
- Middle Eastern markets saw an iPhone adoption boost of 18%, driven by premium demand among young adults.
- In emerging markets, budget Android phones continue to outpace iPhone sales by a factor of 8 to 1.
Trends in iPhone and Android Adoption Rates (Recent Developments)
- Global smartphone shipments are projected to rebound by 5% in 2025.
- iPhone 15 Pro sales exceeded expectations, with a 15% YoY growth in North America.
- Foldable Android phones like the Galaxy Z Flip 5 saw a 30% growth year-over-year.
- Apple Vision Pro (AR headset) integration has increased ecosystem loyalty among iPhone users.
- 5G smartphone adoption hit 81% globally, with Android devices representing 70% of the 5G-capable units.
- Mid-range Android devices priced between $300–$500 gained popularity, accounting for 45% of Android sales.
- iPhone SE (2025) received strong traction in budget-conscious markets, increasing Apple’s share in Southeast Asia.
- Android One devices saw reduced adoption.
- Wearable tech integration continues driving iPhone sales; 62% of new iPhone buyers also purchased an Apple Watch.
- Environmental concerns influenced purchase decisions for 31% of smartphone buyers, boosting refurbished iPhone demand.
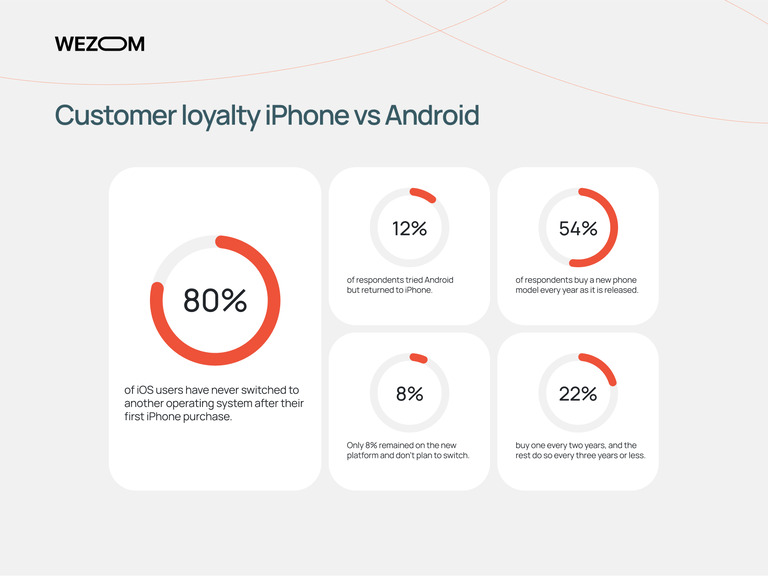
Customer Loyalty: iPhone vs Android
- 80% of iOS users have never switched to another operating system after their first iPhone purchase.
- 12% of respondents tried Android but eventually returned to iPhone.
- 54% of respondents buy a new phone every year as soon as a new model is released.
- Only 8% of users stayed on a new platform after switching and have no plans to return.
- 22% of users buy a new phone every two years, while the rest upgrade every three years or less.
Conclusion
Whether you tap on an iPhone or swipe through an Android, it’s clear the smartphone ecosystem has never been more dynamic. iPhone continues to dominate in profitability, user loyalty, and premium branding, while Android leads the charge in diversity, global reach, and innovation accessibility. In 2025, users are better informed and more selective, valuing ecosystem integration, security, and longevity as much as flashy features. The smartphone battle isn’t about who wins—it’s about who best fits your world.
Sources
- https://www.androidpolice.com/android-move-to-iphone-after-12-years/
- https://www.statista.com/statistics/272698/global-market-share-held-by-mobile-operating-systems-since-2009/
- https://www.tomsguide.com/face-off/iphone-vs-android
- https://www.androidauthority.com/ios-vs-android-1068950/
- https://www.forbes.com/sites/zakdoffman/2025/06/03/why-you-should-stop-texting-on-your-iphone-or-android-phone/
- https://www.techadvisor.com/article/2651876/i-switched-from-android-to-iphone-after-12-years.html


