WHAT WE HAVE ON THIS PAGE
- Editor’s Choice
- Number of Smartphone Users Worldwide (2014–2028)
- Global Smartphone Adoption Rates
- Smartphone Dependency Over Time
- Global Smartphone Market Share
- Operating System Market Share
- Average Smartphone Prices Worldwide
- Smartphone Users by Country
- Smartphone Penetration by Region
- Mobile Internet Usage vs. Desktop Usage
- Where People Use Their Smartphones
- Smartphone User Demographics
- Smartphone Upgrade and Replacement Trends
- Smartphone Usage in the US (Daily)
- Most Popular Smartphone Models
- Smartphone Features Driving Purchase Decisions
- Leading Activities Among Smartphone Users Worldwide
- Smartphone Usage Patterns and Screen Time
- Time Spent with Apps and Browsers Using Smartphones
- The Impact of Phones on Our Daily Activities
- Mobile App Download and Usage Statistics
- Impact of 5G on Smartphone Adoption
- Environmental Impact and Smartphone Recycling Statistics
- Recent Developments in the Smartphone Industry
- Conclusion
- Sources
Imagine walking into a coffee shop in 2025. Nearly everyone you see is glued to a small, glowing screen, their faces lit with the familiar hue of their smartphones. From teenagers scrolling through social media to business professionals managing meetings on the go, the smartphone has evolved from a luxury to a necessity. It’s not just a communication device anymore—it’s an extension of daily life. As we dive into the smartphone statistics of 2025, the numbers reveal a fascinating story of innovation, connection, and societal transformation.
Editor’s Choice
- Smartphone ownership has reached an unprecedented 89% of the global population by early 2025.
- Apple retains its crown as the top manufacturer, commanding 24.5% of the global market share.
- Android continues to dominate the operating system market with a 71.8% share worldwide.
- The average smartphone replacement cycle has dropped to 2.4 years globally.
- The average selling price (ASP) of smartphones in 2025 climbed to $426, reflecting increasing demand for premium models.
- 5G smartphone adoption rose sharply to account for 68% of all devices in active use worldwide.
- Mobile internet usage officially surpassed desktop usage by 71%, solidifying smartphones as the primary gateway to the web.
Number of Smartphone Users Worldwide (2014–2028)
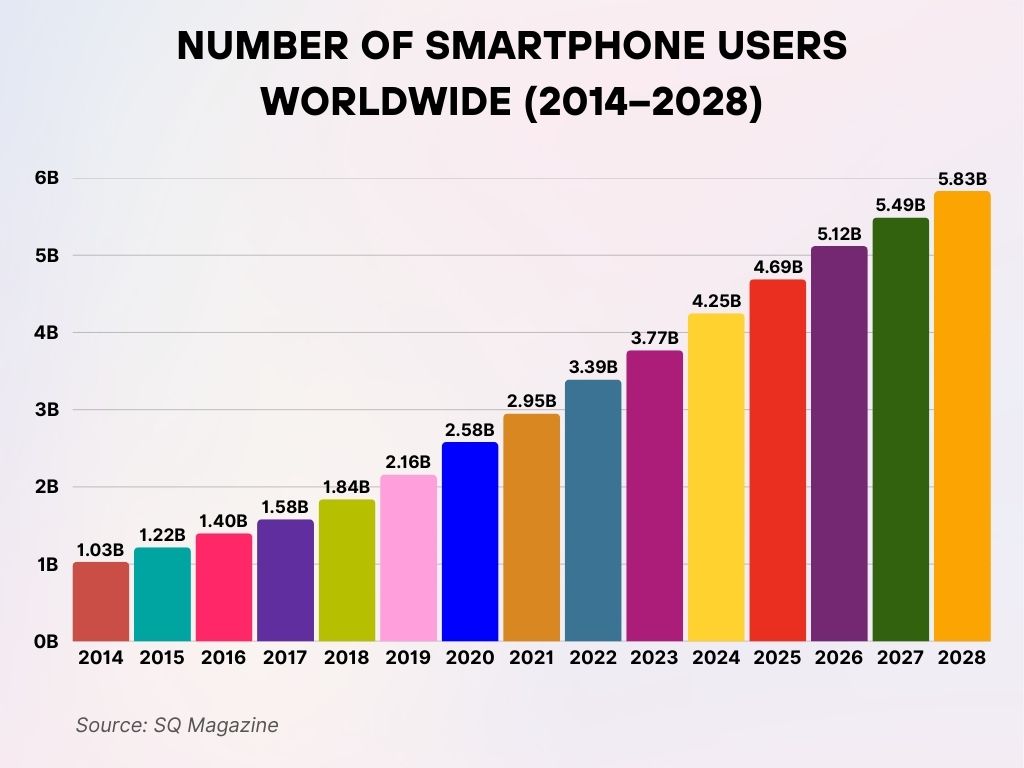
- In 2014, there were 1.03 billion smartphone users worldwide.
- In 2015, the number grew to 1.22 billion.
- By 2016, smartphone users reached 1.4 billion globally.
- In 2017, the figure rose to 1.58 billion.
- 2018 saw smartphone users climb to 1.84 billion.
- In 2019, the global smartphone user base expanded to 2.16 billion.
- By 2020, smartphone users worldwide totaled 2.58 billion.
- In 2021, the number increased to 2.95 billion.
- 2022 recorded 3.39 billion smartphone users globally.
- In 2023, users rose further to 3.77 billion.
- The projection for 2024 is 4.25 billion smartphone users.
- By 2025, the number is expected to reach 4.69 billion.
- In 2026, smartphone users are forecasted to hit 5.12 billion.
- 2027 estimates show 5.49 billion smartphone users worldwide.
- By 2028, the global smartphone user count is projected to be 5.83 billion.
Global Smartphone Adoption Rates
- As of 2025, there are an estimated 7.3 billion smartphones in active circulation worldwide.
- The smartphone adoption rate among adults in developed nations has crossed 95%, led by countries like the United States, South Korea, and Sweden.
- In developing regions, smartphone adoption surged by 11% year-over-year, driven by affordable models and mobile-first internet access.
- China boasts the largest number of smartphone users, accounting for 26% of the global total.
- In Africa, smartphone ownership reached 46% of the population, a significant rise from 35% in 2023.
- Latin America’s smartphone penetration climbed to 78%, showing steady growth fueled by economic expansion and digital initiatives.
- The Middle East and North Africa (MENA) region surpassed the 70% smartphone ownership milestone in 2025.
Smartphone Dependency Over Time
- 72% of Americans admit they cannot go a full day without their smartphones.
- The average adult now checks their smartphone 344 times a day in 2025.
- 51% of users globally say they experience anxiety when separated from their smartphones.
- Mobile banking usage on smartphones increased to 62% compared to 41% five years ago.
- 70% of smartphone users prefer texting over calling, citing convenience and speed.
- Smartphone use before bedtime is reported by 83% of users, with significant impacts on sleep quality.
- Digital detox efforts increased, but only 18% of users were able to significantly reduce their screen time.
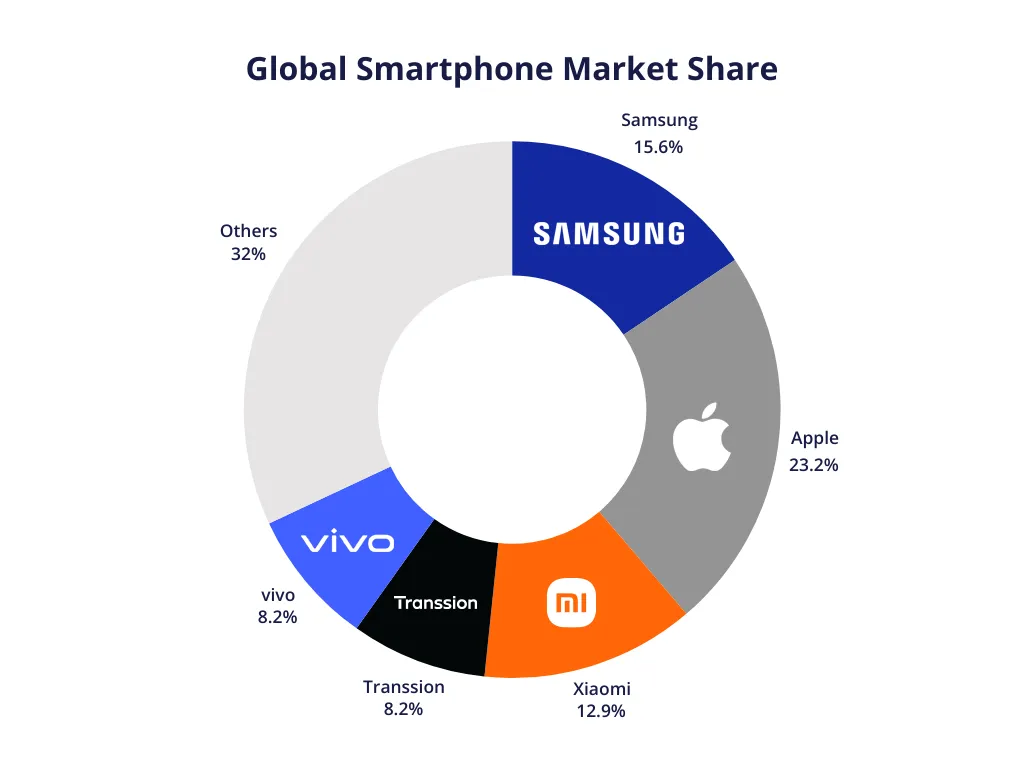
- Apple holds the largest share with 23.2% of the global smartphone market.
- Samsung follows with a 15.6% market share.
- Xiaomi commands 12.9% of the global market.
- Vivo captures 8.2% market share.
- Transsion also holds 8.2% of the market.
- Others collectively account for 32% of the global smartphone market.
- Android leads globally with a 71.8% market share in 2025.
- iOS accounts for 27.5%, with strong loyalty in the US, Japan, and parts of Europe.
- In North America, iOS dominates with a 59% share compared to Android’s 40%.
- In India, Android maintains a commanding 93% share.
- The European Union markets show a near-even split, with Android at 58% and iOS at 41%.
- HarmonyOS by Huawei claims 2% of the Chinese smartphone OS market.
- Windows Phone and Blackberry OS will officially fall to 0% active use globally by 2025.
Average Smartphone Prices Worldwide
- The average selling price (ASP) of a smartphone globally in 2025 is $426, a modest increase from $409 in 2024.
- In the United States, the average smartphone price stands at $657, reflecting a preference for premium models.
- Europe’s ASP is around $512, boosted by strong sales of flagship devices.
- In contrast, Asia’s ASP is lower at $326, driven by high competition among mid-range brands.
- Latin America’s smartphone ASP climbed to $298, up 4% year-over-year.
- Africa maintains the lowest ASP at $179, owing to the popularity of budget smartphones.
- Foldable smartphones have an average selling price of $1,212 in 2025, showing a 22% decrease from initial launch prices.
- Refurbished smartphone prices rose to an average of $259, as demand for sustainable tech grows.
Smartphone Users by Country
- Vietnam has 61.37 million smartphone users.
- Germany records 65.24 million smartphone users.
- Mexico has 70.14 million smartphone users.
- Japan has 75.77 million smartphone users.
- Russia is home to 99.93 million smartphone users.
- Brazil has 109.34 million smartphone users.
- Indonesia reports 160.23 million smartphone users.
- United States has 270 million smartphone users.
- India boasts 439.42 million smartphone users.
- China leads with 911.92 million smartphone users.

Smartphone Penetration by Region
- North America leads smartphone penetration, with 91% of the adult population owning a device.
- Europe follows closely with 88% smartphone penetration in 2025.
- Asia-Pacific reports a 76% penetration rate, reflecting the digital push in emerging markets.
- The Middle East and North Africa (MENA) achieved 71% smartphone ownership.
- Latin America crossed the 78% mark, fueled by expanding mobile broadband coverage.
- Sub-Saharan Africa saw penetration rise to 51%, a 6% increase from 2024.
- Australia and Oceania reported a smartphone penetration rate of 89% in 2025.
- Urban smartphone penetration globally averages 91%, while rural areas trail at 58%.
Mobile Internet Usage vs. Desktop Usage
- In 2025, 71% of all internet traffic globally will come from mobile devices.
- The US sees 68% of internet access originating from smartphones.
- In India, mobile internet usage accounts for a staggering 91% of total web traffic.
- Desktop usage continues to decline, accounting for just 25% of global internet access.
- Mobile-first indexing is now the norm for 100% of Google’s web pages.
- Average monthly mobile data usage per smartphone user hit 23 GB globally.
- Streaming services like Netflix and YouTube account for 63% of all mobile data traffic.
- 5G users consume on average 1.9 times more mobile data than 4G users.
Where People Use Their Smartphones
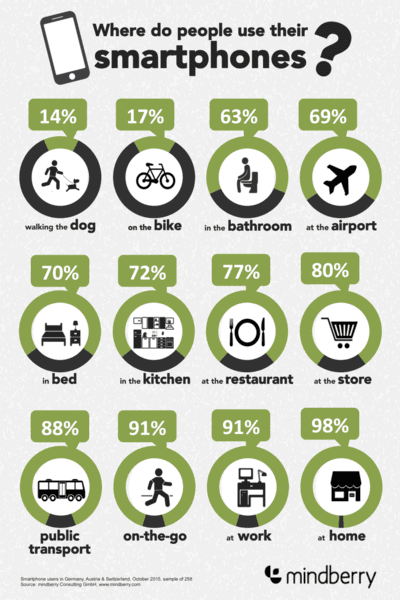
- 14% use smartphones while walking the dog. It shows how mobile our digital habits have become.
- 17% use smartphones on the bike. People stay connected even during physical activities.
- 63% use smartphones in the bathroom. Digital engagement continues even in private moments.
- 69% use smartphones at the airport. Travelers rely heavily on their devices while waiting.
- 70% use smartphones in bed. Nighttime scrolling is now a common routine.
- 72% use smartphones in the kitchen. Multitasking with technology has become second nature.
- 77% use smartphones at the restaurant. Dining often blends with browsing or social media.
- 80% use smartphones at the store. Shoppers use phones for price checks and reviews.
- 88% use smartphones on public transport. Commuters turn travel time into digital time.
- 91% use smartphones on-the-go. Staying connected while moving is now essential.
- 91% use smartphones at work. Workspaces are increasingly dominated by mobile communication.
- 98% use smartphones at home. Home remains the biggest hub for smartphone usage.
Smartphone User Demographics
- Gen Z leads smartphone ownership, with 98% of those aged 18-24 owning a device.
- Millennials follow closely, with 96% smartphone penetration among users aged 25-40.
- Baby Boomers saw smartphone ownership rise to 83% in 2025.
- 53% of global smartphone users are male, while 47% are female.
- In the US, smartphone ownership among seniors (65+) reached 77%, up from 70% in 2023.
- Teens (ages 13-17) spend an average of 7.2 hours per day on their smartphones.
- 65% of smartphone users globally say they prefer shopping online via mobile over desktop.
- In emerging markets, urban users account for 64% of smartphone owners, compared to 36% in rural regions.
Smartphone Upgrade and Replacement Trends
- The average smartphone replacement cycle globally is 2.4 years in 2025.
- In the US, the upgrade cycle shortens to 2.1 years, driven by carrier incentives.
- 42% of consumers cite battery degradation as the top reason for upgrading.
- Foldable phones encouraged 18% of users to upgrade earlier than planned.
- In Europe, environmental concerns led to a 12% drop in frequent smartphone replacements.
- 56% of users trading in old smartphones choose to recycle or resell.
- 31% of consumers are willing to buy refurbished smartphones to save costs.
- 5G compatibility is the second-highest reason for upgrading, with 33% of users citing it as a must-have feature.
Smartphone Usage in the US (Daily)
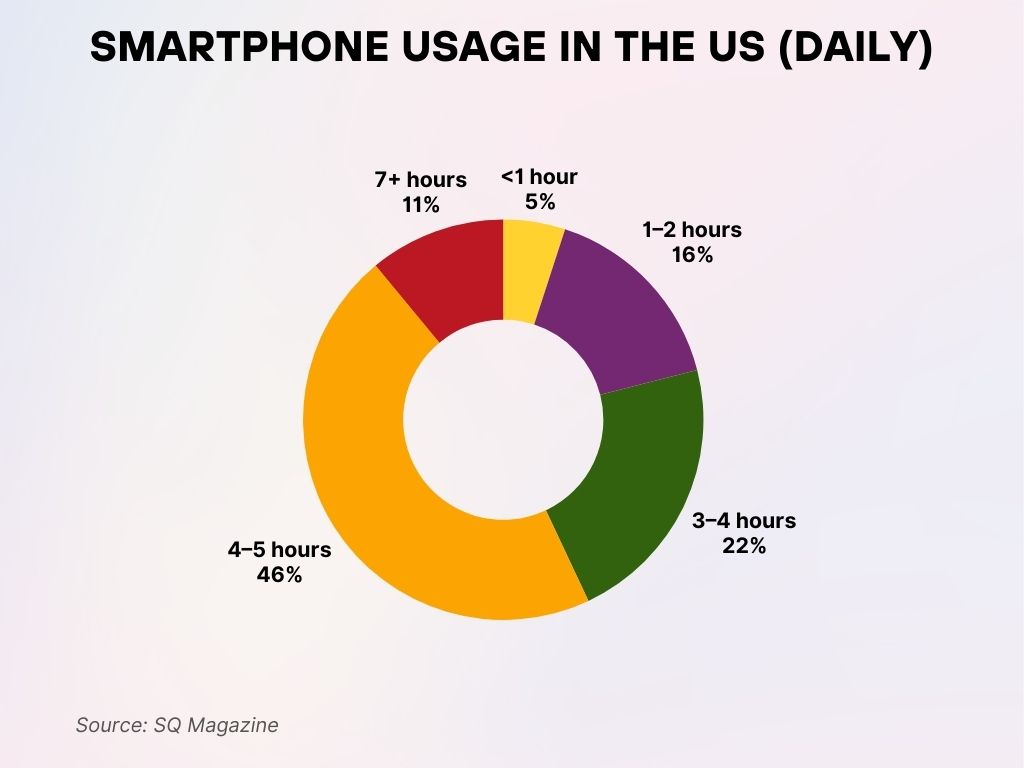
- 5% of users spend less than 1 hour on their smartphones each day.
- 16% of users spend around 1–2 hours daily on their smartphones.
- 22% of users spend 3–4 hours per day on their smartphones.
- 46% of users spend 4–5 hours daily using their smartphones.
- 11% of users spend over 7 hours a day on their smartphones.
Most Popular Smartphone Models
- iPhone 15 Pro Max is the world’s best-selling smartphone in early 2025.
- Samsung Galaxy S24 Ultra ranks second in global sales.
- Xiaomi 14 Pro secured the third spot with strong demand in Asia and Europe.
- In the US, the iPhone 15 and iPhone 15 Pro models dominate the top five charts.
- The Google Pixel 8 Pro gained popularity, ranking among the top ten models in North America.
- Oppo Find X7 and Vivo X100 Pro achieved record-breaking sales in their home markets.
- Budget models like the Samsung Galaxy A15 and Redmi Note 13 remain top choices in emerging economies.
- Foldable devices, particularly the Samsung Galaxy Z Flip 5, sold 9 million units globally in 2025.
Smartphone Features Driving Purchase Decisions
- Camera quality is the top factor influencing 64% of smartphone buyers.
- Battery life ranks second, important to 58% of consumers.
- Screen size and resolution are deciding factors for 49% of buyers.
- Processing speed and chipset rank high for 43% of users.
- 5G capability is crucial for 41% of users purchasing new phones.
- Durability, including water and dust resistance, matters to 37% of buyers.
- Storage capacity is a critical factor for 35% of smartphone owners.
- Sustainability and eco-friendly design sway 18% of younger buyers.
- Wireless charging support is essential for 24% of buyers upgrading in 2025.
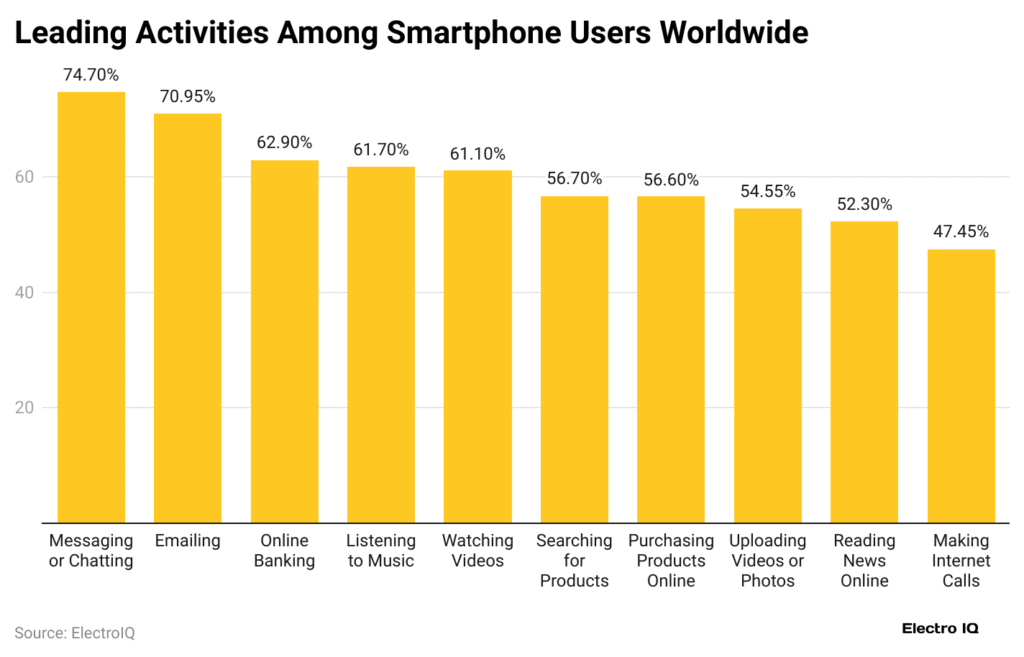
Leading Activities Among Smartphone Users Worldwide
- 74.7% of users engage in messaging or chatting. Staying connected is the top smartphone activity worldwide.
- 70.95% of users use smartphones for emailing. Mobile communication extends beyond just texting.
- 62.9% of users perform online banking. Smartphones have made managing finances more convenient.
- 61.7% of users listen to music. Streaming tunes has become a daily habit.
- 61.1% of users spend time watching videos. Video content remains a major driver of smartphone usage.
- 56.7% of users use smartphones for searching for products. Online browsing has transformed shopping behavior.
- 56.6% of users engage in purchasing products online. Smartphones have made e-commerce more accessible than ever.
- 54.55% of users are uploading videos or photos. Sharing visual content is a big part of mobile interaction.
- 52.3% of users are reading news online. Smartphones are now a primary source of daily news.
- 47.45% of users make internet calls. Voice communication is evolving with internet-based options.
Smartphone Usage Patterns and Screen Time
- The average global screen time on smartphones reached 4.9 hours per day in 2025.
- In the United States, users spend an average of 5.5 hours daily on smartphones.
- Entertainment apps (streaming, gaming) consume 38% of overall screen time.
- Social media usage accounts for 32% of daily smartphone activity worldwide.
- Productivity app usage rose to 14% of total smartphone time.
- 64% of users check their phones within 10 minutes of waking up.
- In 2025, 41% of smartphone users track and limit their screen time using digital wellbeing tools.
- Smartphone multitasking (using multiple apps simultaneously) is reported by 52% of users globally.
Time Spent with Apps and Browsers Using Smartphones
- In 2025, people spent an average of 4.2 hours daily using mobile apps.
- Social networking apps lead the usage time, averaging 1.7 hours per day.
- Video streaming apps like YouTube and Netflix collectively account for 1.3 hours daily.
- Mobile browsing time decreased slightly to 38 minutes per day as app usage dominated.
- Gaming apps saw a 12% year-over-year increase, with users spending 47 minutes daily on mobile games.
- Shopping apps captured 22 minutes daily per user globally, up 8% from 2024.
- Finance and banking app usage increased to 18 minutes on average per user per day.
- Productivity and health apps collectively account for 29 minutes of daily usage.
The Impact of Phones on Our Daily Activities
- 62% of Americans say smartphones make them more productive in their daily tasks.
- 45% admit smartphones sometimes distract them from work or studies.
- Mobile payments are now used by 69% of smartphone users worldwide for daily purchases.
- Smartphone photography has replaced standalone cameras for 81% of casual photographers.
- Navigation apps are used daily by 58% of smartphone owners for commuting and travel.
- Health tracking (e.g., steps, heart rate) through smartphones is adopted by 46% of users globally.
- Mobile learning apps contribute to 32% of users engaging in online education or skill development.
- 72% of people use smartphones as their primary alarm clocks.
Mobile App Download and Usage Statistics
- Globally, smartphone users downloaded 142 billion apps in 2024.
- Gaming apps represented 34% of all mobile downloads.
- Finance app downloads grew by 19% year-over-year, driven by digital banking trends.
- Health and fitness apps reached 16% growth in downloads compared to 2024.
- TikTok remained the most downloaded app globally in the first quarter of 2025.
- CapCut, a video editing app, moved into the global top five for downloads.
- Shopping apps saw a surge, with Amazon and Shein among the top 10 downloaded apps worldwide.
- Paid app downloads declined slightly by 3%, as freemium models dominated the marketplace.
Impact of 5G on Smartphone Adoption
- 5G smartphones now represent 68% of all devices in use globally.
- In the US, 83% of new smartphone sales are 5G-enabled models.
- Average mobile download speeds with 5G surpassed 220 Mbps globally in early 2025.
- Video streaming quality improved significantly, with 4K streaming becoming standard on mobile devices.
- Cloud gaming adoption increased by 27%, powered by 5G capabilities.
- Remote work and telehealth services expanded accessibility through faster mobile networks.
- In developing regions, 5G deployment led to a 9% increase in smartphone adoption rates.
- Smart cities initiatives in countries like South Korea and Singapore heavily leveraged 5G smartphone penetration.
Environmental Impact and Smartphone Recycling Statistics
- 56% of users globally participated in smartphone recycling or trade-in programs in 2025.
- Apple and Samsung reported collecting over 25 million old devices each for recycling last year.
- Only 22% of users properly recycle smartphones when devices reach end-of-life status.
- E-waste from smartphones alone contributed an estimated 10.2 million tons globally in 2024.
- The refurbished smartphone market grew by 17% year-over-year, helping reduce carbon footprints.
- Leading smartphone brands are committed to using 75% recycled materials in new devices by 2030.
- Energy-efficient chipsets reduced smartphone power consumption by 19% in 2025 compared to 2022.
- Extended warranties and right-to-repair initiatives boosted device longevity by an average of 18 months.
Recent Developments in the Smartphone Industry
- Foldable smartphones saw global shipments rise by 36% year-over-year.
- AI-powered cameras became standard, with 77% of premium smartphones integrating AI photography features.
- Satellite communication features were introduced in flagship models by Apple, Samsung, and Huawei.
- Battery technology advancements extended average smartphone battery life by 23% compared to 2023.
- Smartphones with under-display front cameras reached 11% market share in premium segments.
- Quantum encryption technology trials started in smartphones, promising ultra-secure communication.
- Leading brands accelerated the transition to eSIM-only devices, covering 32% of new smartphones.
- Wearable integration with smartphones has advanced, with 41% of smartphone users owning connected smartwatches.
Conclusion
The story smartphones tell in 2025 is one of acceleration and adaptation. What began as a simple communication device has evolved into a personal assistant, health monitor, entertainment hub, and financial tool—so tightly woven into daily life that imagining a day without it feels nearly impossible. The statistics clearly show not just widespread adoption, but deep integration into every aspect of modern living. As technology continues to leap forward with 5G, AI, foldables, and sustainability efforts, smartphones will keep reshaping the way we interact with the world—and with each other.
Sources
- https://www.statista.com/topics/840/smartphones/
- https://en.wikipedia.org/wiki/List_of_countries_by_smartphone_penetration
- https://www.nature.com/articles/s41390-025-04108-8
- https://theconversation.com/heres-how-to-maintain-healthy-smartphone-habits-236555
- https://www.crosswalk.com/headlines/contributors/michael-foust/study-links-smartphone-use-to-mental-health-crisis-among-teens.html
- https://www.researchgate.net/publication/347332270_Why_are_smartphones_disruptive_An_empirical_study_of_smartphone_use_in_real-life_contexts


