WHAT WE HAVE ON THIS PAGE
- Editor’s Choice
- Reported Health Symptoms After Smart Technology Use
- Mental Health Impact Statistics
- Technology and Sleep Disruption Rates
- Daily Screen Time on Computer vs. Phone
- Social Isolation and Loneliness Metrics
- Decline in Physical Activity Linked to Technology Use
- Public Perception of Technology’s Impact on Education
- Impact of Technology on Children and Adolescents
- Workplace Productivity and Technology Distraction Data
- Social Media Worries by Generation
- Cyberbullying and Online Harassment Figures
- Screen Time Growth and Its Effects
- Social Media Addiction by Age Group in the US
- Technology Addiction Statistics
- Data Privacy and Security Concerns
- Smartphone Usage Habits in the UK
- Educational Disruption Due to Technology Overuse
- Environmental Impact of Digital Technologies
- Recent Developments
- Conclusion
- Sources
It starts with a buzz—notifications lighting up your screen, tabs multiplying faster than thoughts, and the silent hum of technology weaving itself into every corner of daily life. It’s subtle, almost invisible. But beneath the convenience and connectivity lies a ripple effect few of us are prepared for.
As we step further into 2025, the conversation has shifted. We’re no longer just asking how to use tech more efficiently—we’re asking how it’s affecting our well-being. This article unpacks the negative effects of technology through a deep dive into current data, helping you understand what’s happening, who it’s affecting most, and where we’re headed next.
Editor’s Choice
- 73% of Americans say they feel more distracted now than five years ago due to digital devices.
- 1 in 3 teens experience anxiety symptoms linked directly to excessive smartphone use.
- 60% of remote workers report burnout caused by always-on communication platforms.
- On average, Americans check their phones 144 times per day in 2025.
- 42% of children aged 6-12 exceed recommended screen time limits daily.
- 68% of adults report worsened sleep quality due to technology use before bed.
- Cyberbullying reports rose by 17% in 2024, largely fueled by social media app usage among youth.
Reported Health Symptoms After Smart Technology Use
- Neck/shoulder pain was the most commonly reported issue, affecting 37.7% of users after ST use.
- Sleep disturbances impacted 36.6% of users, making it the second most frequent health complaint.
- Headaches were reported by 35% of users, highlighting a significant neurological effect.
- Loss of concentration affected 24.2% of respondents, pointing to cognitive side effects.
- Blurry vision was noted by 20.7%, indicating possible strain on visual health.
- Lower-back pain was experienced by 18.7% of users following ST use.
- Dry eyes were reported by 17.9%, likely due to prolonged screen exposure or strain.
- Obesity was identified in 13.6% of users, suggesting a potential link to sedentary behavior.
- Eye flashes were experienced by 13.3%, which may be a sign of visual fatigue or stress.
- Near-sightedness was reported by 10.4%, potentially indicating long-term vision impairment.
- Transient vision loss affected 4.2%, though less common, it’s a serious concern.
- Eye squint was reported by 2.3%, possibly from focusing on screens too closely.
- Seizures were the least reported symptom, occurring in 1.6% of cases.

Mental Health Impact Statistics
- 56% of Gen Z users say social media negatively impacts their mental health, up from 47% in 2023.
- A 2025 APA study found that excessive digital engagement is linked to a 40% higher risk of depression.
- Adults who spend more than 7 hours a day on screens are twice as likely to experience anxiety disorders.
- In the US, suicidal ideation among teens rose 13% from 2023 to 2025, correlating with online peer pressure.
- Teletherapy demand increased by 61% since 2020, with tech overuse cited as a common trigger.
- People who engage in doomscrolling for over 90 minutes daily report 35% lower life satisfaction.
- Among employees, digital overload is now a leading contributor to workplace mental fatigue.
- Social comparison via platforms like Instagram and TikTok is a top factor in self-esteem decline, especially among young women.
- Nearly 1 in 4 college students report feeling isolated despite being constantly connected online.
- Digital detox retreats in the US saw a 34% year-over-year booking increase in 2024.
Technology and Sleep Disruption Rates
- 85% of Americans use screens within one hour of going to sleep, impacting circadian rhythms.
- Blue light exposure before bed is shown to delay melatonin production by 60%.
- Children aged 5–10 who use tablets before bed get 22 minutes less sleep on average.
- Sleep disorders tied to tech usage rose by 19% from 2023 to 2025.
- Smartphone notifications disrupt deep sleep cycles in 37% of adults, according to recent sleep lab findings.
- Teens who spend more than 4 hours on screens daily are 70% more likely to report poor sleep quality.
- A CDC 2025 report notes that 58% of high school students report chronic sleep deprivation, with screen use as a top cause.
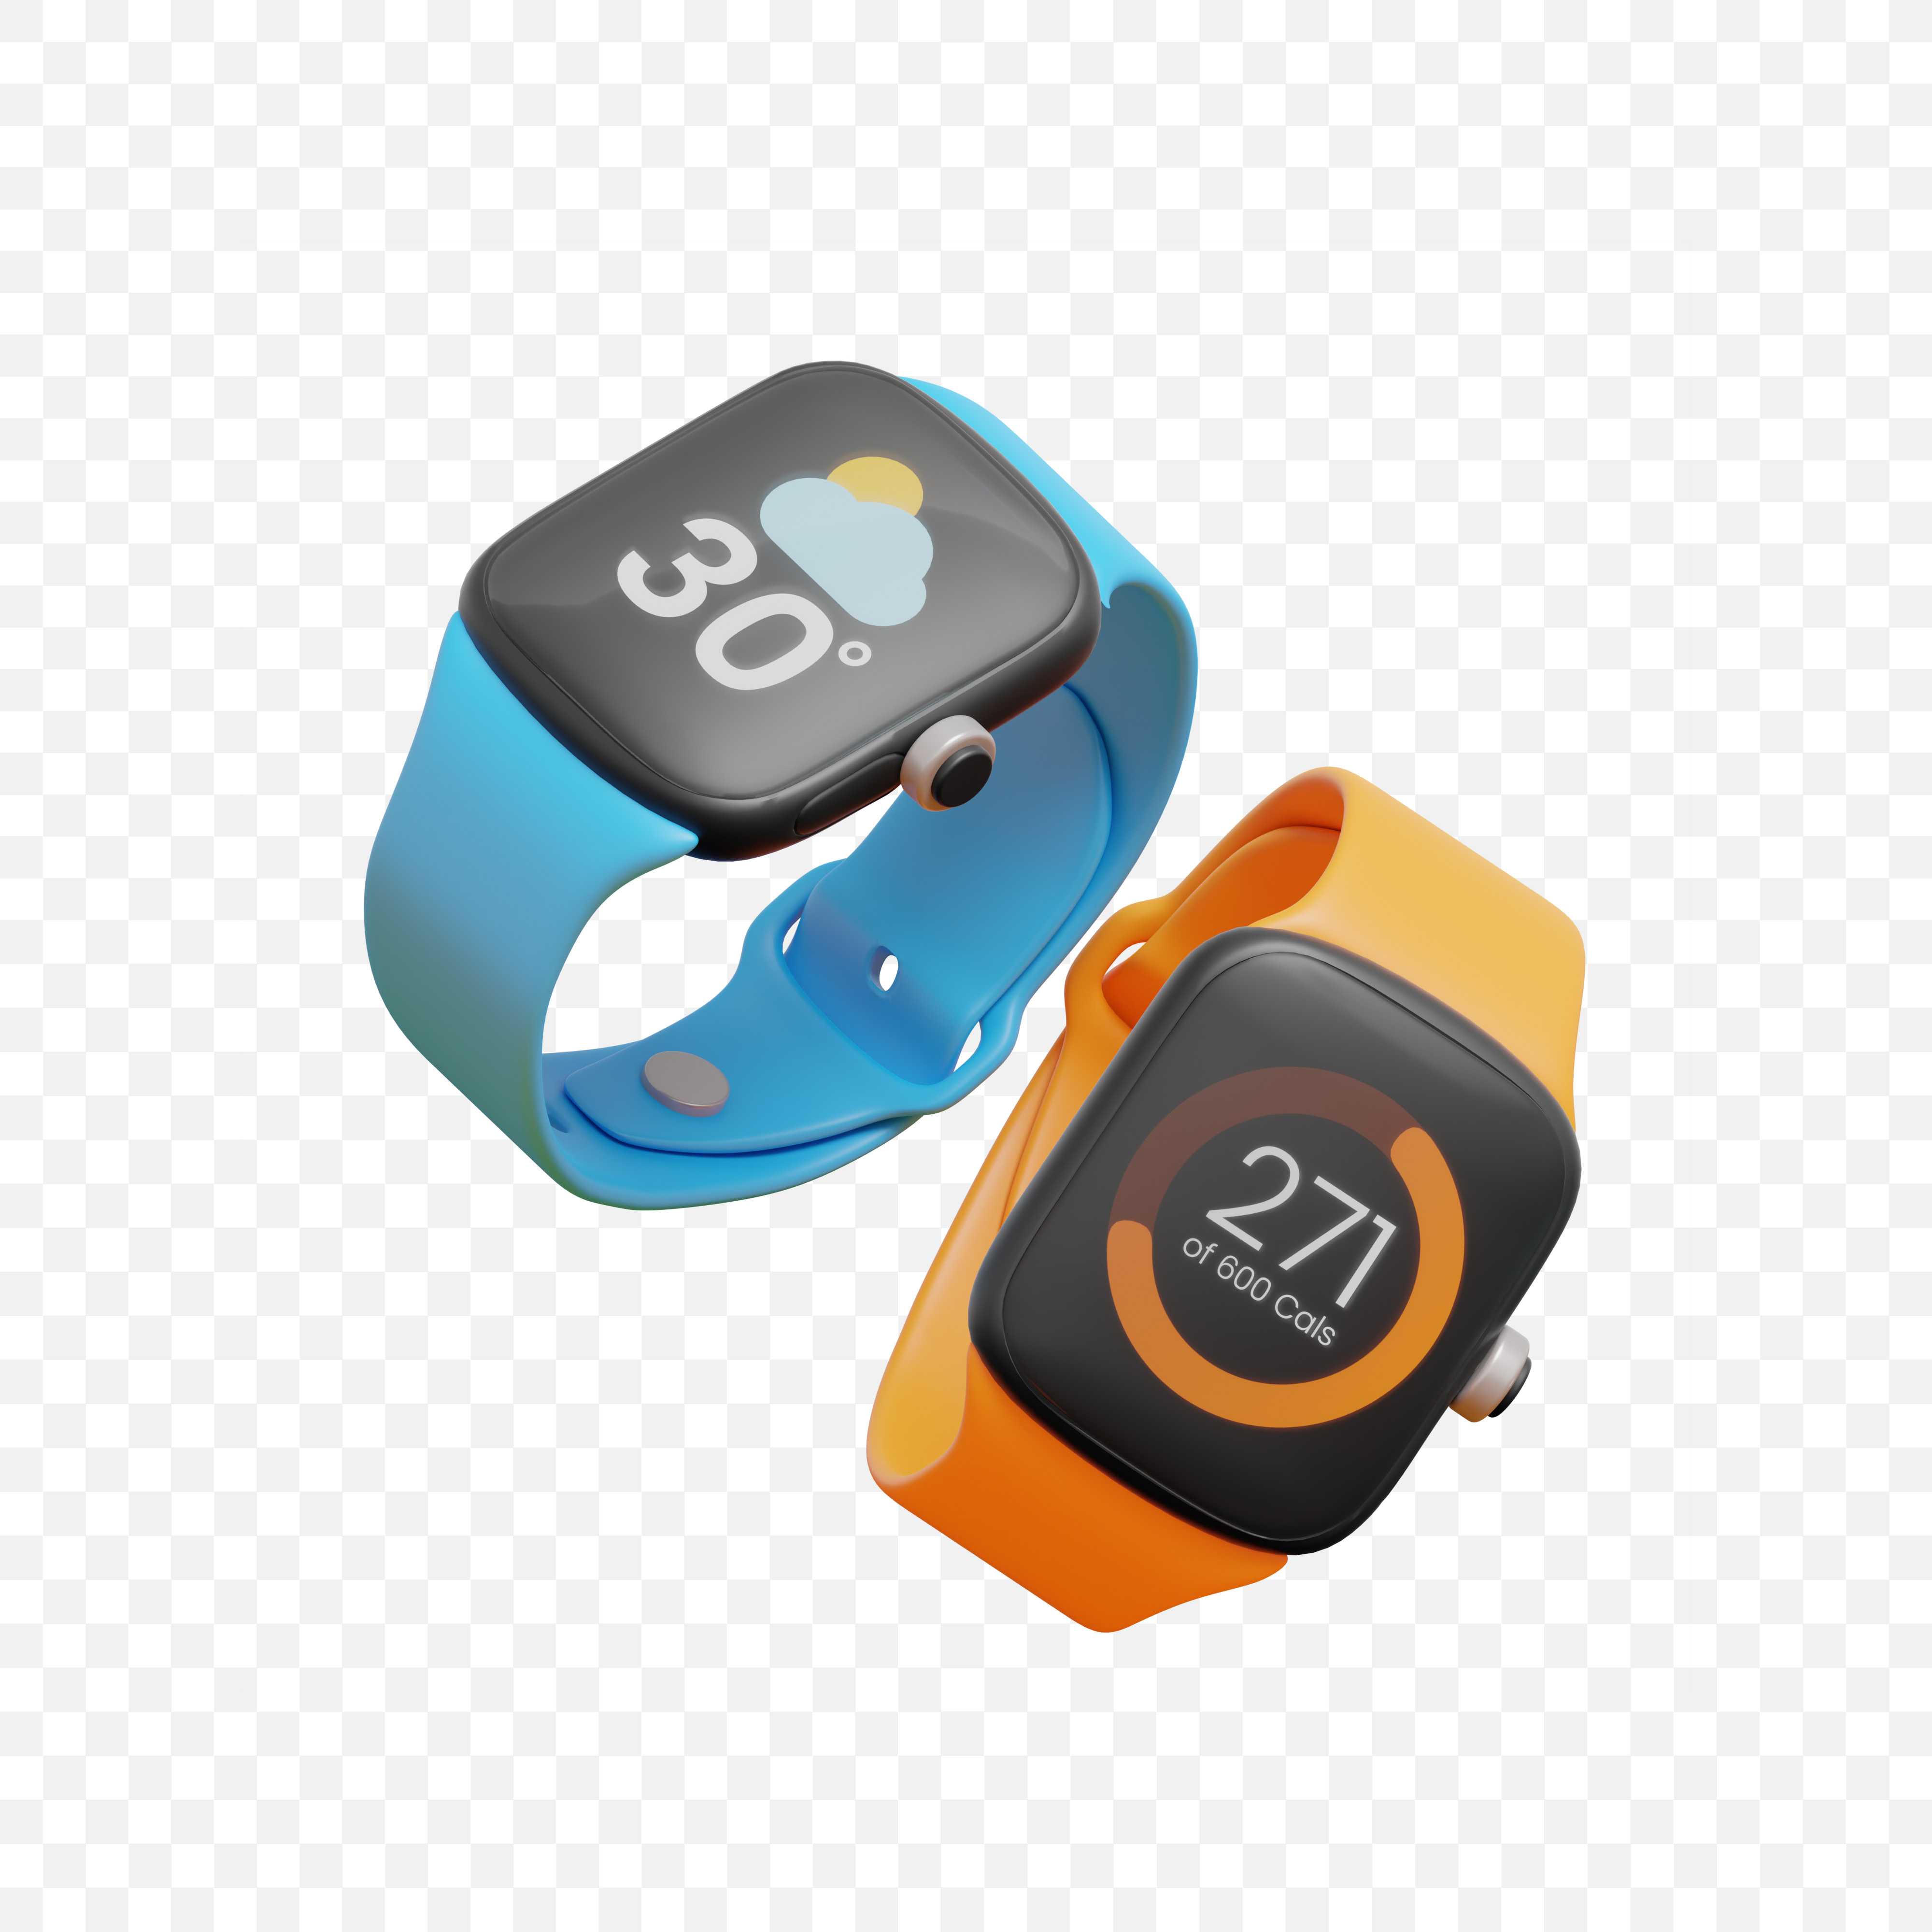
- Smartwatch sleep tracking alerts wake 1 in 6 users unnecessarily, reducing overall sleep effectiveness.
- Sleep tech itself is becoming a paradox: 40% of users say their sleep tracking devices increase anxiety about not sleeping enough.
- Insomnia diagnoses among adults aged 30–50 have increased by 12% since 2023, often tied to nighttime screen habits.
Daily Screen Time on Computer vs. Phone
- Only 5% of people spend less than 1 hour on a computer, while 9% do so on a phone.
- 22% use a computer for 1–3 hours daily, compared to a much higher 45% for phone usage.
- The largest share, 47%, spend 3–8 hours daily on a computer, with 36% doing the same on their phone.
- 26% of people use a computer for more than 8 hours a day, while only 10% report this level of phone usage.

- Despite being digitally connected, 49% of Americans report feeling lonelier in 2025 than they did a decade ago.
- Young adults aged 18–24 are the loneliest demographic, with nearly 60% reporting frequent feelings of isolation.
- Remote workers experience 26% more loneliness than their in-office peers, according to a 2024 Gallup poll.
- The use of AI chatbots and virtual companions is up by 300%, yet 71% of users say it does not reduce real-life loneliness.
- Social media use exceeding 3 hours per day correlates with 32% higher reported isolation scores.
- Senior citizens using video calls frequently still report a 25% drop in perceived social connection compared to in-person visits.
- Virtual friendships have replaced in-person ones for 1 in 5 teenagers, leading to a loss of empathy and communication skills.
- Households with more than 5 smart devices report greater emotional detachment among family members.
- A global loneliness index showed a 15% year-over-year increase in 2024 among tech-heavy populations.
- Online-only relationships are now the primary form of connection for 27% of Americans under 30.
Decline in Physical Activity Linked to Technology Use
- The average daily step count in the US has decreased by 12% between 2020 and 2025, attributed largely to sedentary tech usage.
- Children aged 8–15 who spend more than 4 hours daily on screens are 40% less likely to meet physical activity guidelines.
- Fitness tracker data from 2024 shows a drop of 18% in outdoor workouts among users aged 25–34.
- According to the CDC, 1 in 3 American adults is now classified as physically inactive, an all-time high.
- 65% of parents say their children would rather play video games than participate in physical sports or outdoor activities.
- Gaming and streaming habits have been directly linked to a 16% rise in obesity rates among teens since 2022.
- A 2025 report from the WHO found that sedentary lifestyles caused by technology contribute to 5 million deaths globally each year.
- Ergonomic injuries, such as neck, wrist, and back strain, have risen 22% in the US workplace since 2023 due to poor posture during extended tech use.
- Virtual PE classes introduced during the pandemic resulted in 38% lower physical engagement compared to in-person sessions.
- Digital fitness apps, while helpful, see a user drop-off rate of 72% within the first 90 days of download.
Public Perception of Technology’s Impact on Education
- 0% of respondents view technology as having an extremely negative impact on education.
- 42% of respondents believe technology has a mostly positive impact on education, making it the most common viewpoint.
- 38% say technology has an extremely positive impact, showing strong support for its educational benefits.
- 19% feel that technology brings both positive and negative effects in equal measure to the education sector.
- Less than 1% think technology has a mostly negative impact on education.

Impact of Technology on Children and Adolescents
- 95% of teens in the US own a smartphone as of 2025, up from 89% in 2023.
- 70% of children under 12 use tablets for learning and play, with half exceeding 2 hours of daily screen time.
- According to the American Academy of Pediatrics, early screen exposure before age 2 is linked to language delays in 30% of toddlers.
- Cyberbullying and digital peer pressure are now cited in 28% of adolescent therapy cases.
- School-age children who spend over 3 hours per day on devices are twice as likely to develop attention-related issues.
- In 2024, US school districts reported a 21% decline in student focus and attention span, partly due to device dependency.
- Family meals disrupted by devices happen in 62% of American households, affecting bonding and communication.
- Teen girls aged 13–17 who heavily use social media report 59% higher instances of body image concerns.
- The “phantom vibration syndrome”, where teens feel a phone vibration that didn’t occur, affects 89% of daily users.
- Parental control apps saw a 19% growth in downloads in 2024, signaling rising concern over unsupervised digital access.
Workplace Productivity and Technology Distraction Data
- The average knowledge worker is distracted every 3 minutes by emails, chat apps, or notifications.
- Digital distractions cost the US economy an estimated $650 billion annually in lost productivity.
- Employees spend 28% of their workweek managing email and 20% switching between tools, per a McKinsey report.
- 40% of Zoom users admit to multitasking during meetings, reducing retention and engagement.
- The average remote worker checks communication platforms more than 77 times per day.
- Employee burnout related to digital overload rose 36% in 2024, affecting mid-level managers the most.
- A 2025 survey shows that 65% of professionals feel more anxious due to constant app notifications.
- Digital presenteeism—being online but not productive—is up 18% post-pandemic.
- 35% of workers say they can’t focus for more than 15 minutes without feeling the urge to check a device.
- Employers who limit app notifications saw a 23% rise in productivity, according to a recent pilot program.
- 48% of Millennials worry that social media negatively affects their physical and mental health, the highest among all age groups.
- 37% of Gen Xers also express concern about the harmful impact of social media on their well-being.
- Only 22% of Boomers report similar worries, showing less sensitivity toward social media’s health effects.
- 15% of Matures are concerned about social media’s impact, making them the least worried demographic in this survey.

Cyberbullying and Online Harassment Figures
- Cyberbullying incidents in US schools rose by 17% from 2023 to 2024, with girls aged 12–16 being the most affected.
- 1 in 4 teens in the US have experienced some form of online harassment in the past 12 months.
- Social media platforms like TikTok and Instagram account for nearly 70% of cyberbullying reports.
- 60% of LGBTQ+ youth report being harassed online based on their identity, up from 52% in 2023.
- Online gaming environments saw a 31% rise in toxic behavior and verbal abuse, especially in competitive games.
- AI-powered deepfakes and image manipulation are now used in 13% of cyberbullying cases, creating new safety challenges.
- Teachers and school staff are increasingly targeted online, with 14% reporting cyber harassment in 2024.
- A growing concern: only 36% of cyberbullying victims report the incident to an adult or authority figure.
- Cyberstalking cases in the US increased by 21% year-over-year, according to FBI reports.
- New anti-harassment tech laws introduced in 7 US states in 2024 aim to curb youth-targeted abuse on digital platforms.
Screen Time Growth and Its Effects
- The average American now spends over 7.5 hours daily on screens—up from 6.9 hours in 2023.
- Children under 8 are logging 2.5 hours of daily screen time, far beyond the AAP’s recommendation of 1 hour.
- Screen time during leisure now accounts for more hours than sleep in many teens’ routines.
- A Harvard study in 2024 found that each additional hour of screen time reduces academic performance by 0.3 GPA points.
- Increased screen time correlates with 19% higher sedentary behavior, especially during non-school hours.
- Eye strain and vision issues tied to screen overuse now affect 71% of adults aged 25–44.
- Digital eye syndrome, including dry eyes and blurred vision, impacts over 55 million Americans.
- Dual-screen multitasking (watching TV while scrolling) is practiced by 62% of adults, leading to reduced focus.
- Blue light blocking glasses saw a 41% increase in sales in 2024, driven by growing concern over screen exposure.
- The number of people actively trying “screen-free Sundays” rose by 28% year-over-year, reflecting a shift in digital wellness awareness.
- 30% of total US online users say they are somewhat addicted to social media, while 9% admit being completely addicted.
- Among 18–22-year-olds, a high 40% identify as somewhat addicted, but only 5% claim complete addiction.
- 23–38-year-olds show 37% somewhat addicted and 15% completely addicted — the highest complete addiction rate across all age groups.
- In the 39–54 age group, 26% report somewhat addiction, and 9% report complete addiction.
- The 55–64-year-olds are the least affected, with 21% somewhat addicted and just 1% completely addicted.

Technology Addiction Statistics
- In 2025, 38% of adults in the US self-identify as being “addicted” to their smartphones—up from 31% in 2023.
- Tech addiction treatment centers in the US report a 29% increase in patient intake over the past year.
- 1 in 5 teenagers spends more than 7 hours a day on their phone, which is considered clinically significant for dependency.
- Gaming addiction now affects 11% of adolescent males, with World Health Organization guidelines classifying it as a disorder.
- Digital detox programs have grown into a $560 million industry as of 2025, highlighting rising demand.
- Smartphone separation anxiety (nomophobia) is present in 66% of Gen Z adults, according to a 2024 behavioral health study.
- App usage restriction tools like Apple’s Screen Time or Google’s Digital Wellbeing are actively used by only 23% of users, despite broad awareness.
- Social media addiction impacts 37% of US college students, with compulsive checking behavior reported every 10 minutes or less.
- Wearable tech usage has extended screen addiction, as 47% of users check notifications without even realizing it.
- A Canadian study found that dopamine levels spike similarly during social media engagement as they do in gambling scenarios.
Data Privacy and Security Concerns
- 79% of US internet users feel they’ve lost control over how their personal data is collected and used.
- In 2024 alone, over 422 million individuals were impacted by data breaches, a 39% increase from the previous year.
- Children’s data privacy violations surged with 32 lawsuits filed against EdTech platforms in the past 12 months.
- Facial recognition technology is used by 35% of public institutions in the US, raising civil liberty debates.
- Smart home devices now collect an average of 1,500 data points per household per day, often without transparent consent.
- 63% of mobile apps request permissions unrelated to their core functions, increasing vulnerability to misuse.
- Data brokers in 2025 operate with minimal regulation, selling user profiles for as little as $0.002 per user.
- AI-generated scams and phishing attacks rose by 22% year-over-year, targeting older adults at disproportionately high rates.
- 81% of Gen Z express concern over how brands use their online behavior to personalize ads.
- Despite security concerns, only 21% of users read privacy policies in full before accepting terms.
Smartphone Usage Habits in the UK
- 54% of people never check their phones when they wake up in the middle of the night, while 17% do so frequently.
- While watching TV, 54% check their phones very or fairly frequently, and only 14% say they never do.
- Only 26% of respondents never use their phone while working, with 35% doing so frequently.
- 43% of people check their phones not very frequently during dinner out, while 46% say they never do.
- 34% never look at their phones before going to sleep, but 43% do so frequently.
- While having dinner at home, 46% never use their phone, while 18% do it frequently.
- 84% of respondents never use their phone while driving, and only 4% admit to doing so frequently.

Educational Disruption Due to Technology Overuse
- Students in grades 6–12 who multitask with tech during study hours retain 37% less information, according to a 2024 Stanford study.
- Elementary school teachers report a 42% drop in attention span compared to five years ago.
- US schools using 1:1 device programs saw mixed results: only 34% reported academic improvement, while 48% reported increased distraction.
- Digital fatigue is now a common complaint among students after virtual classes, affecting 62% of middle schoolers.
- Cheating via smartphones or AI tools rose by 28% in high schools between 2023 and 2025.
- Physical education participation dropped 19% in schools where students are allowed unrestricted device access.
- Teachers report spending 25% more time managing tech-related behavioral issues than they did in 2020.
- AI-written homework and assignments surged in usage, with 31% of high school students admitting to using them regularly.
- Libraries in 63% of schools have shifted to digital-only models, reducing opportunities for deep reading.
- Students who took screen-free test prep courses outperformed digital learners by 18% on average SAT scores in a 2024 pilot program.
Environmental Impact of Digital Technologies
- Data centers now account for 3.5% of global carbon emissions, nearly doubling from 2% in 2020.
- One Google search consumes roughly 0.3 Wh of energy, and the platform processes 8.5 billion searches per day.
- E-waste reached 61.3 million metric tons in 2024, with only 17.4% properly recycled, according to the UN.
- Cryptocurrency mining contributes to 0.9% of global electricity use, primarily powered by non-renewable energy.
- Streaming a 2-hour HD movie emits as much CO₂ as driving 4 miles, with global streaming growing 26% YoY.
- Smartphone lifecycle averages only 2.5 years, driving up production emissions and rare earth mineral extraction.
- Cloud computing energy use is projected to triple by 2030, with AI workloads being a major driver.
- Digital advertisements create electronic waste through fast-churn hardware cycles, contributing to 21% of short-lived device usage.
- Green IT initiatives are adopted by only 12% of tech firms, despite the potential to reduce emissions by 45%.
- In the US, state-level e-waste laws are inconsistent, leading to 60% of electronics ending up in landfills.
Recent Developments
- Apple and Samsung have launched built-in “Digital Wellbeing” dashboards to help users curb tech addiction.
- The American Psychological Association released new digital wellness guidelines in early 2025 aimed at families and schools.
- Congress is reviewing the “Digital Responsibility Act”, which includes stricter rules on data collection and child protection.
- Mental health apps using AI saw a 48% spike in downloads, showing a shift toward personalized tech-enabled care.
- California and New York schools are piloting “tech-free zones” to improve student focus and social interaction.
- EU regulations now require transparency in AI recommendation algorithms used on social platforms.
- New wearable devices monitor stress levels in real time, helping users understand physiological responses to tech overload.
- Netflix introduced a screen time reminder feature, nudging users to take breaks after extended watching sessions.
- The rise of “slow tech” products, designed to reduce reliance on notifications, is gaining traction among Gen Z and Millennials.
- National “Digital Wellness Month” is being introduced in several countries to raise awareness and promote healthier tech habits.
Conclusion
Technology isn’t inherently harmful. It’s the overuse, misuse, and blind acceptance of it that have led us here. The statistics from 2025 paint a clear picture: we’re more connected than ever, but increasingly fragmented as individuals.
Mental health is strained, attention is fractured, and even our sleep isn’t safe from the glow of a screen. Children are growing up with digital pacifiers, and adults are struggling to disconnect from the always-on world. As convenience accelerates, so does consequence.
Yet within these challenges lie opportunities. Awareness leads to action. With the right education, boundaries, and digital literacy, we can move toward a future where tech enhances life, rather than dominates it.
Sources
- https://www.medicalnewstoday.com/articles/negative-effects-of-technology
- https://etactics.com/blog/negative-effects-of-technology-on-mental-health
- https://www.statista.com/statistics/1134262/negative-effect-of-tech-on-employee-s-well-being-in-the-uk/
- https://www.greenmatch.co.uk/blog/technology-environmental-impact
- https://www.pewresearch.org/short-reads/2020/10/15/64-of-americans-say-social-media-have-a-mostly-negative-effect-on-the-way-things-are-going-in-the-u-s-today/
- https://study.com/academy/lesson/how-technology-impacts-society-the-environment.html
- https://www.healthline.com/health/negative-effects-of-technology
ABOUT AUTHOR